Unicorn Company (Start-up) Analysis
This project analyzes global unicorn startups using venture capital, industry, and geographic data. It explores success patterns through SQL-driven metrics like funding concentration, ROI efficiency, and valuation trends. Visual insights are provided using Tableau dashboards, while SQL and Python power the backend data wrangling.
Project Overview
Purpose
- Analyze startup success patterns using real-world venture capital and funding data
- Identify top-performing industries, investors, and regions
- Uncover trends in valuation growth, ROI efficiency, and geographic clustering
- Apply SQL for complex business logic and analysis
- Integrate Python for preprocessing and automation
Tech Stack
- MySQL via MySQL Workbench
- Python (pandas, SQLAlchemy, pymysql)
- Tableau Public for data visualization
- Jupyter Notebooks for data cleaning
Key Questions Answered
- Which countries and cities produce the most unicorns?
- Which industries dominate unicorn creation?
- How do valuations trend over time?
- Which investors are most active and most successful?
- How efficient are unicorn companies based on ROI?
Visualizations
1. Top Ten Industries by Unicorn Company Count
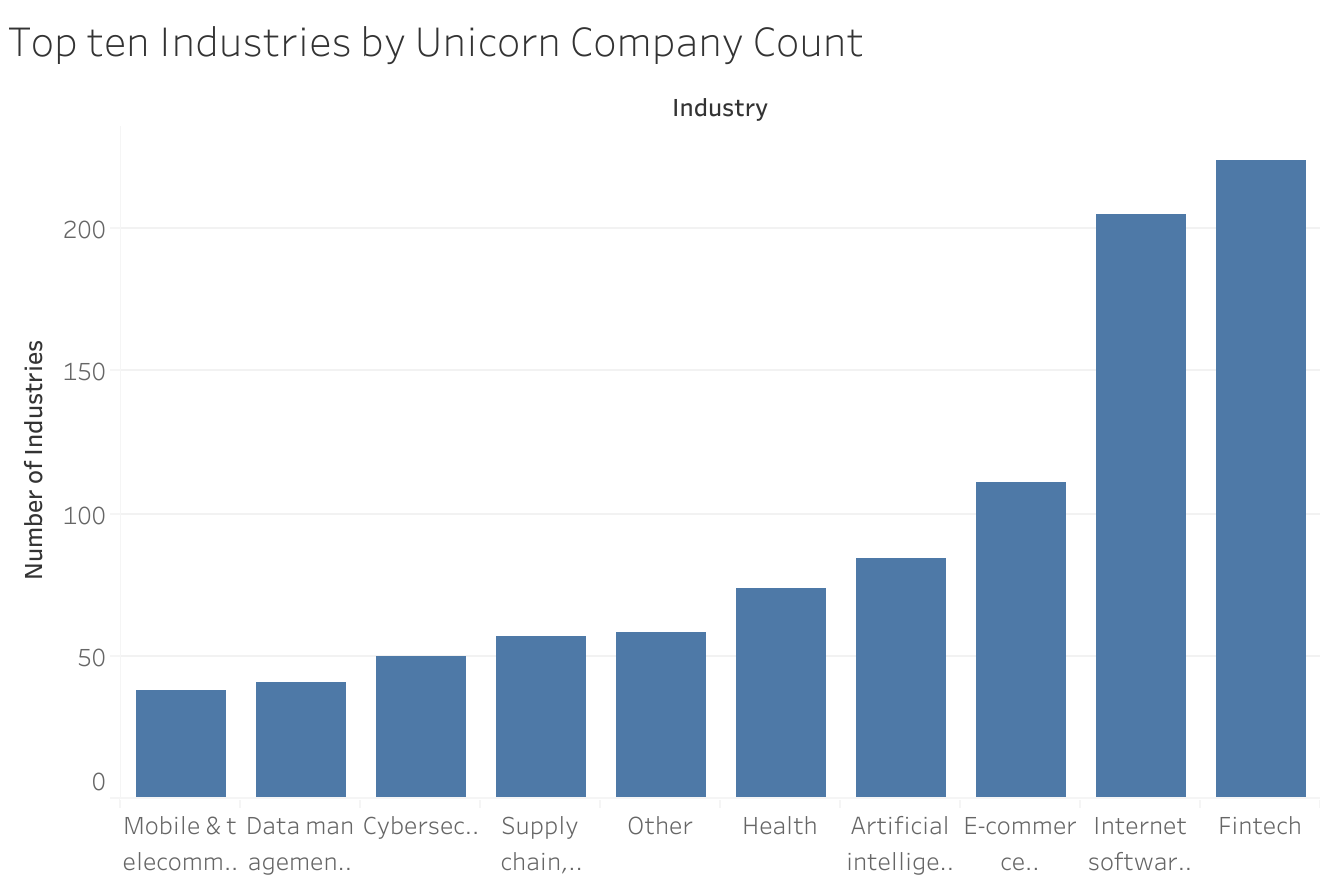
- Internet Software and Fintech are the most prolific industries, accounting for the largest shares of unicorn creation.
- Industry dominance shifted over the decade, with new sectors like HealthTech and AI emerging in later years.
2. Top Ten Countries by Unicorn Company Count
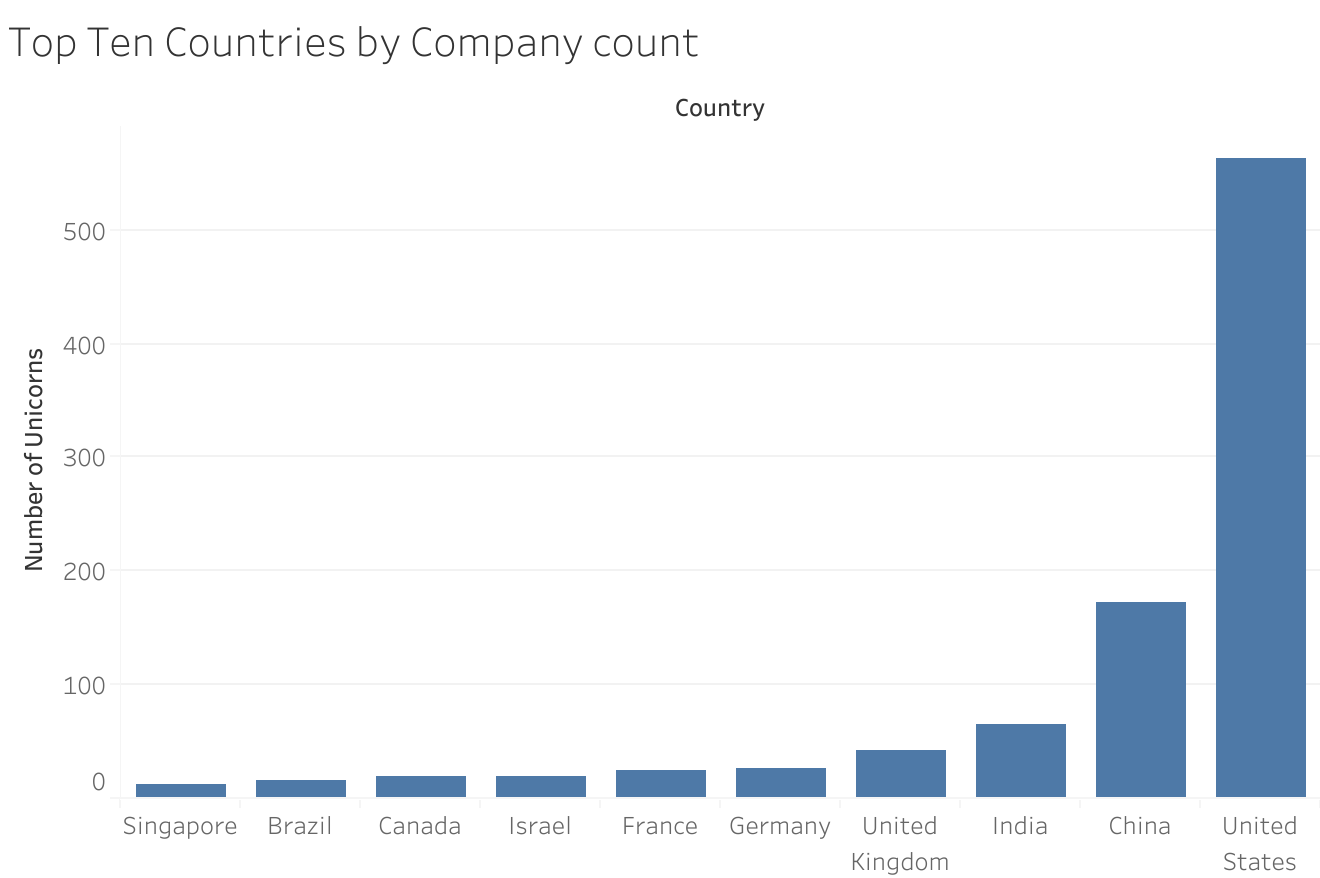
- The United States leads in unicorn company count by a wide margin, followed by China and India.
- Silicon Valley's dominance is reflected in the concentration of unicorns headquartered in San Francisco.
3. Average Valuation by Year
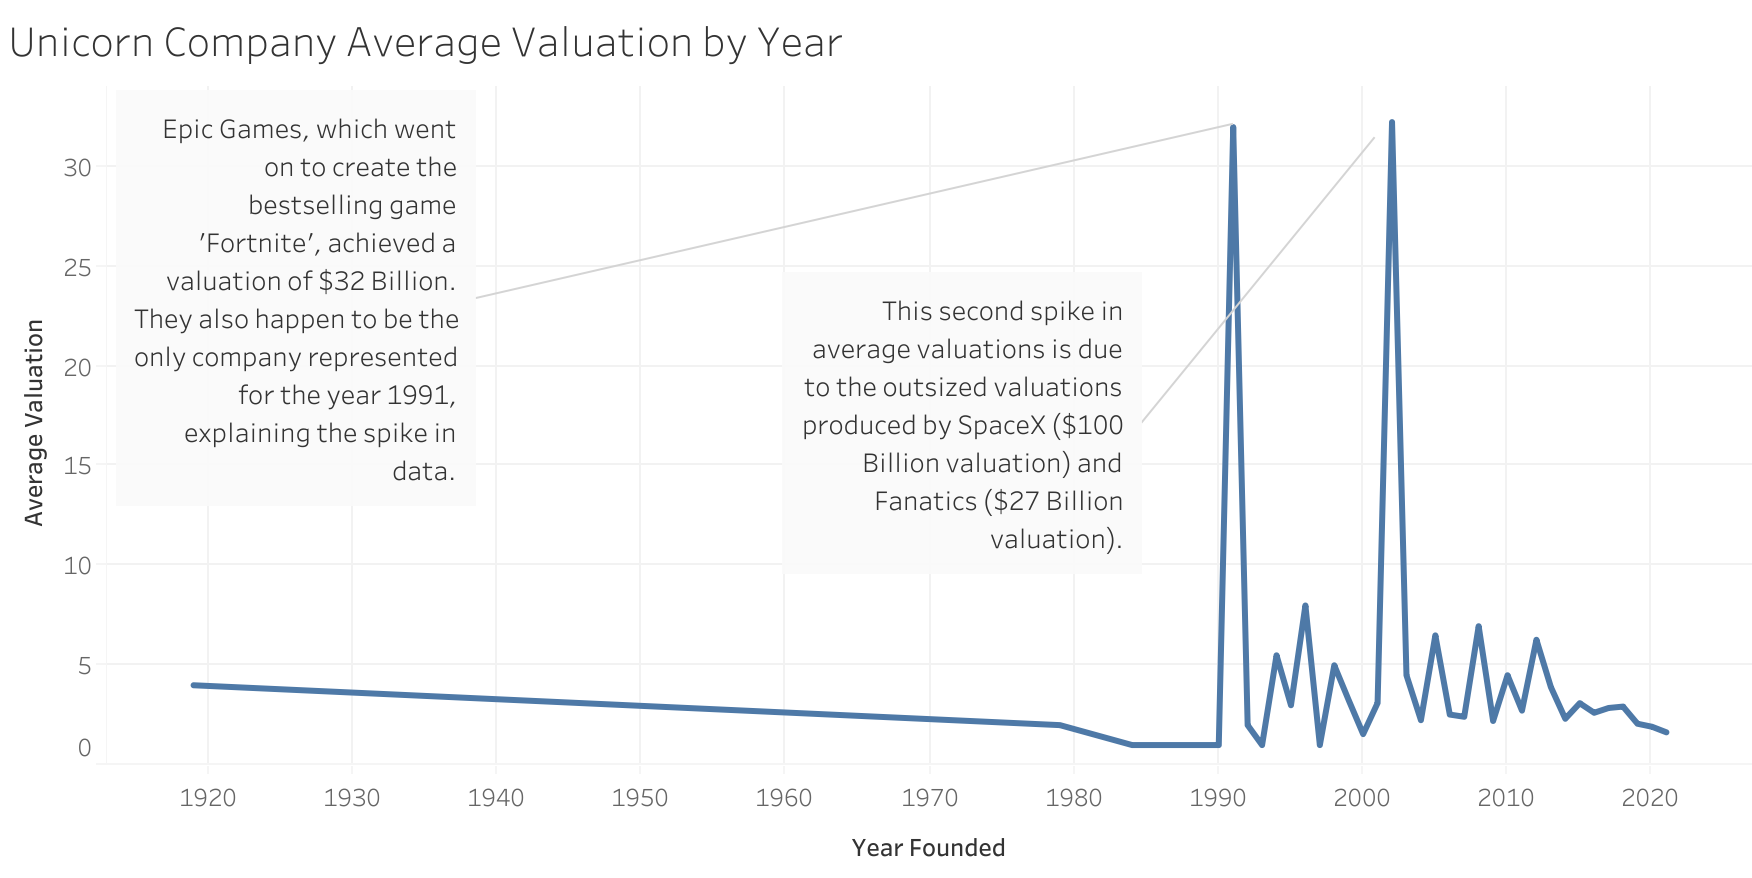
- The average unicorn valuation has steadily increased, peaking for companies founded between 2010–2015.
- Valuations reflect broader funding availability and tech sector momentum.
4. Return on Investment Ratio (Top 20 Unicorns)
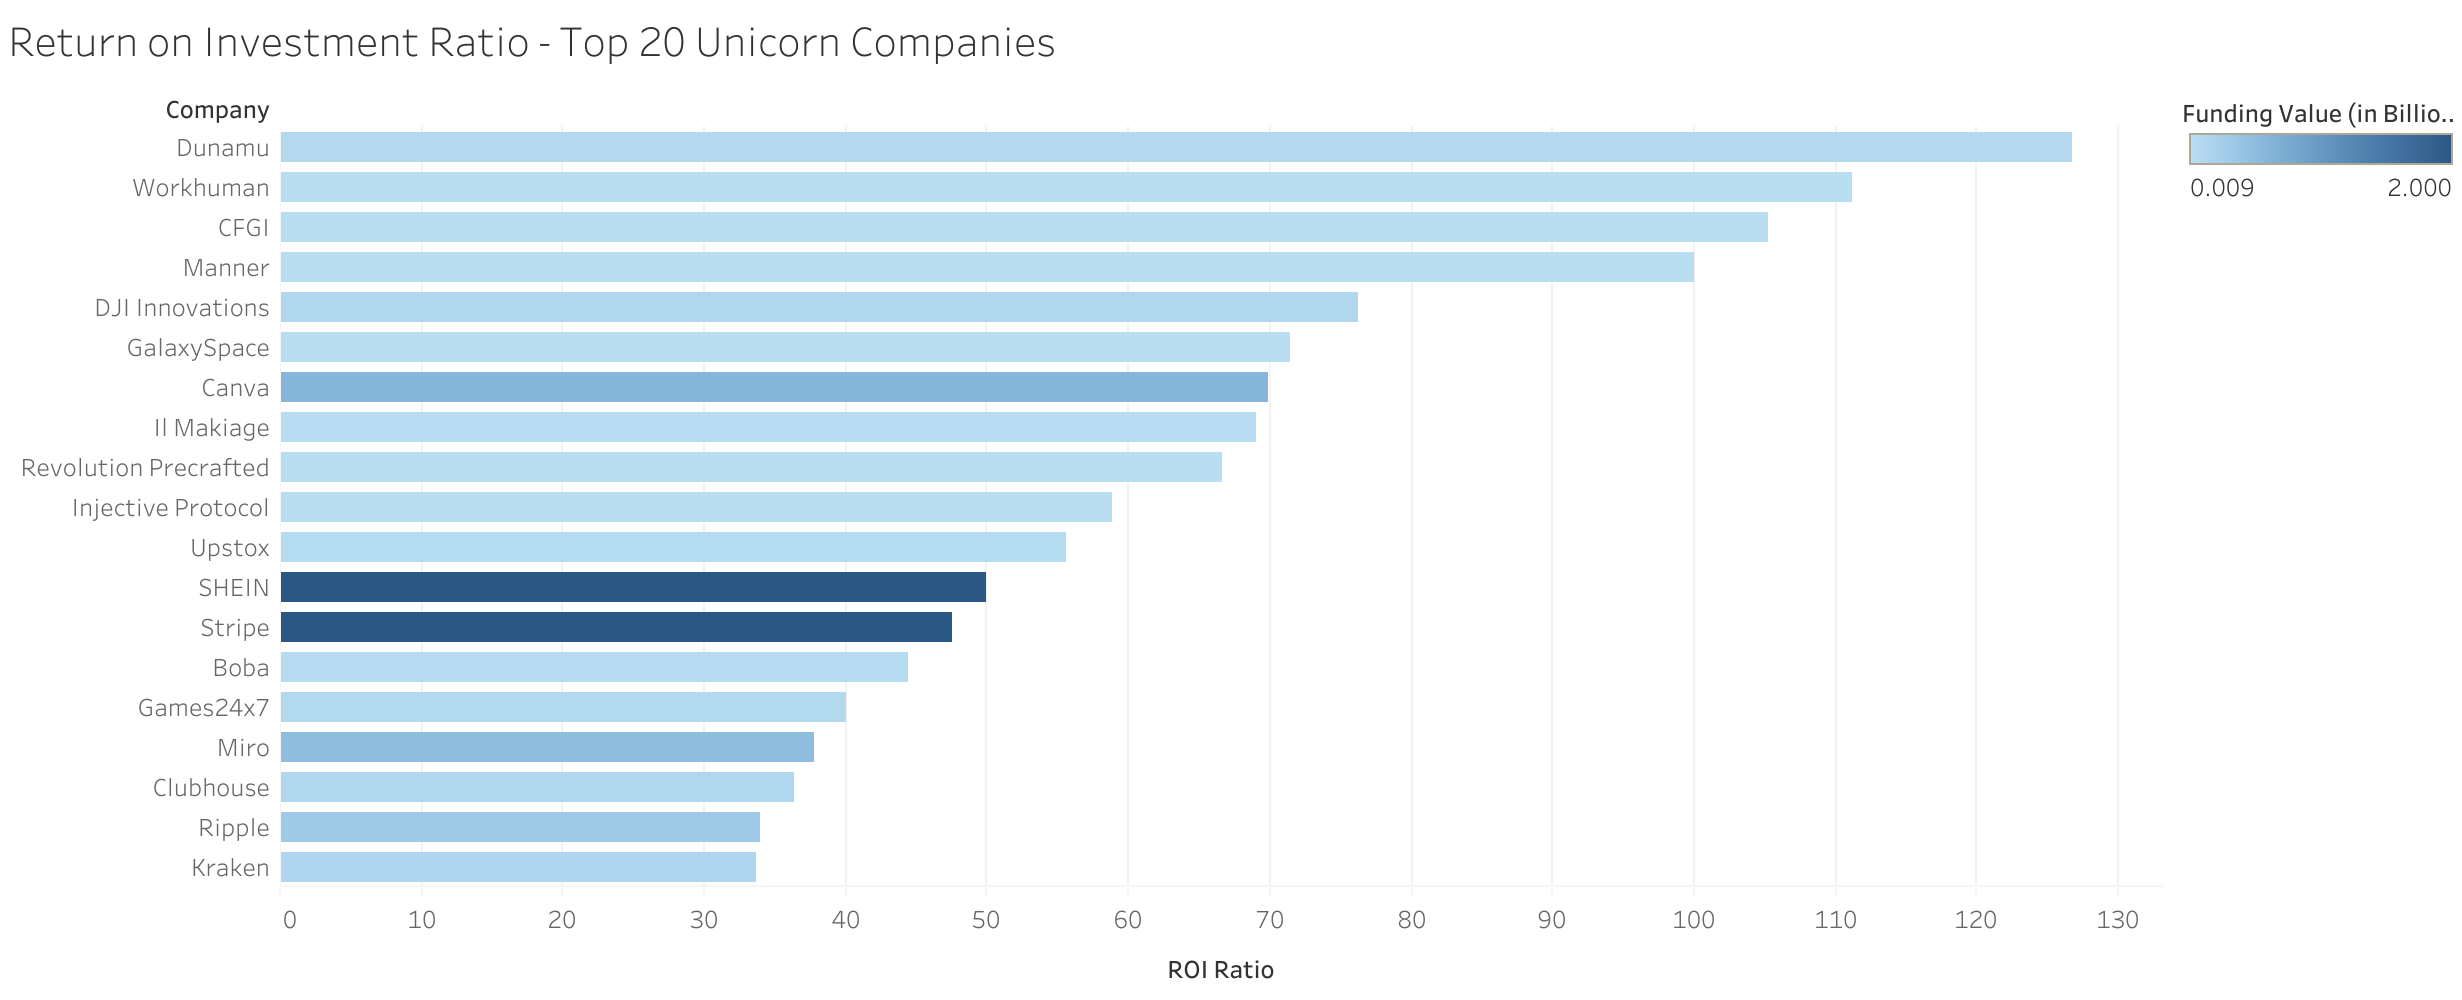
- Canva, Stripe, and Dunamu top the ROI chart, indicating strong capital efficiency and performance.
- High ROI companies often come from SaaS and fintech sectors with scalable, low-cost structures.
5. Most Successful Investors in Unicorn Companies
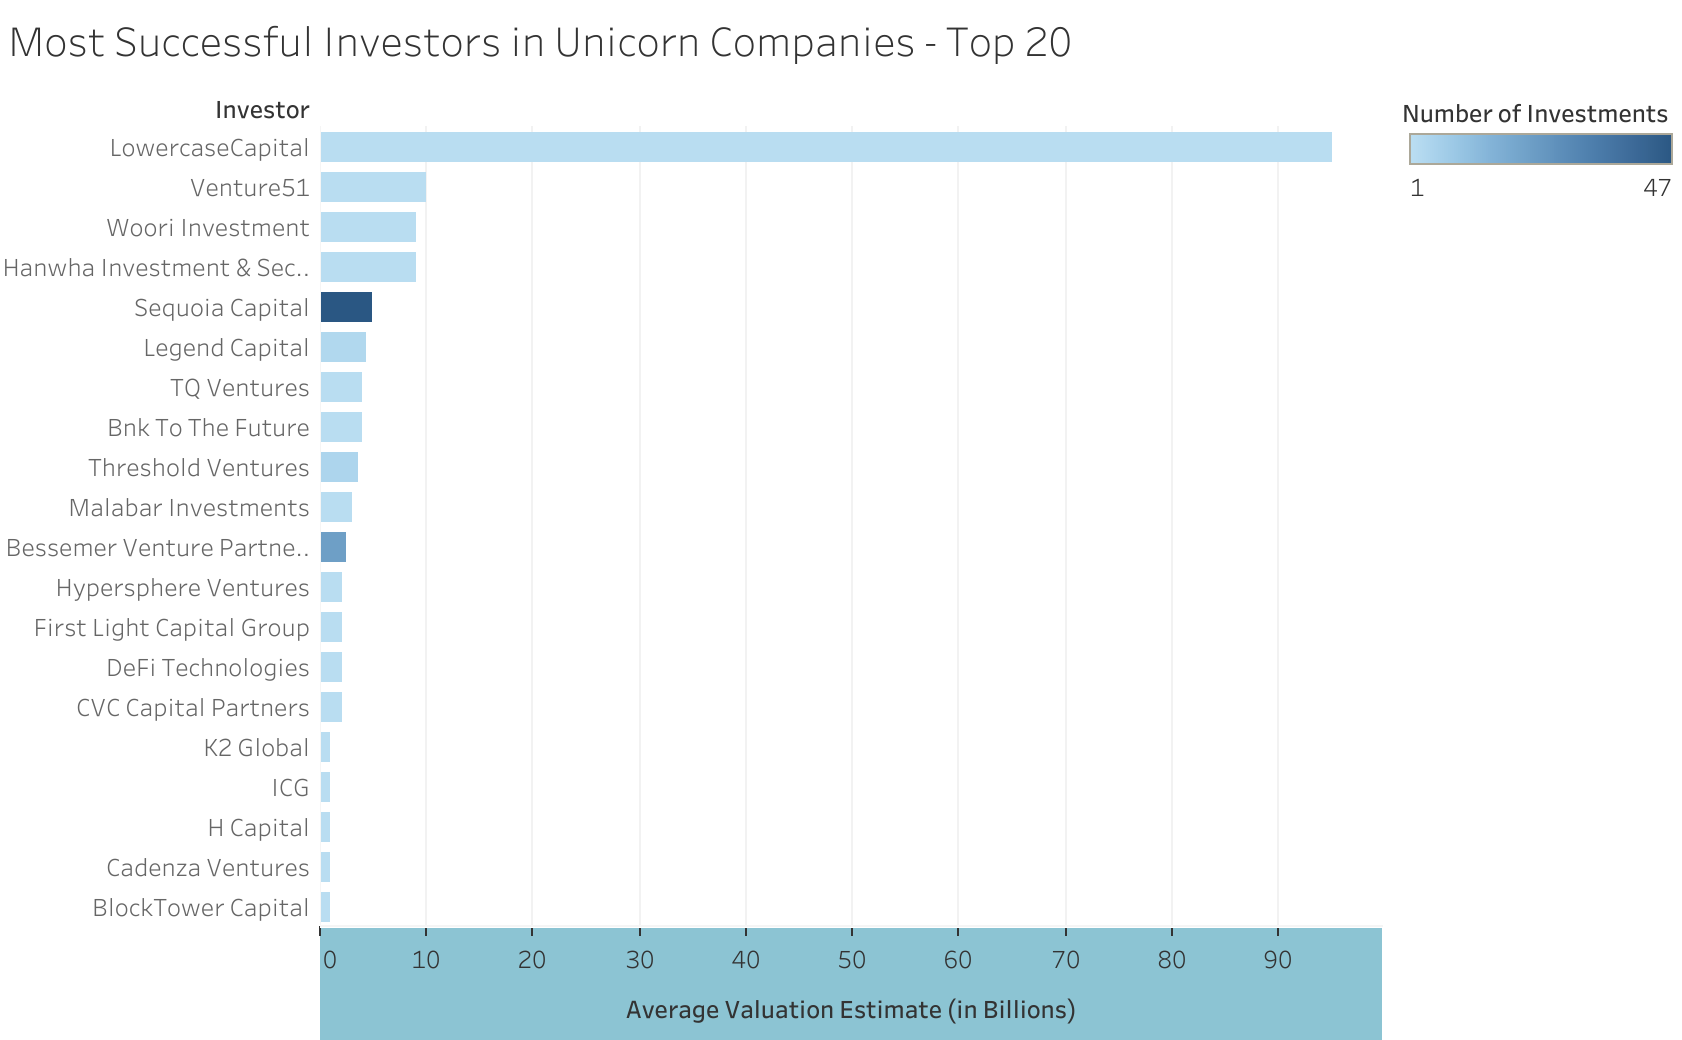
- Sequoia, Accel, and Andreessen Horowitz are among the most active unicorn investors.
- Top investors combine volume with high average valuations, indicating strategic selection of ventures.
Additional Insights
Market Overview
- The United States dominates the unicorn landscape by a wide margin, with China and India following behind.
- San Francisco leads globally for city-based unicorn concentration, highlighting Silicon Valley’s continued importance.
- Unicorn formation accelerated significantly after 2010, corresponding with the rise of mobile technology and venture capital expansion.
Valuation and Funding Trends
- ByteDance, SpaceX, and Stripe are among the most highly valued companies, significantly skewing overall valuation averages.
- While some unicorns have raised enormous funding rounds, high fundraising does not always correlate with highest valuation.
- Certain companies (e.g., Canva, Figma) demonstrated exceptionally high valuation relative to funding raised — signaling strong capital efficiency.
Investor Activity and Performance
- Sequoia Capital, Accel, and Andreessen Horowitz are among the most active unicorn investors based on company count.
- However, being prolific doesn’t always mean producing top valuations: Some smaller investors show stronger average valuation per company invested in.
- The "Most Impactful Investors" combine both high company count and strong average valuations, with Sequoia and Tiger Global emerging as standouts.
- Investor repeatability is common among top VC firms — with frequent participation in multiple unicorns across different industries.
Capital Efficiency and ROI Metrics
- Basic ROI calculations (Valuation ÷ Funding Value) show that Canva, Stripe, and Dunamu are among the highest-performing unicorns relative to investment.
- Companies with high ROI scores often belong to SaaS or fintech sectors, reflecting scalable business models with low marginal costs.
- Some companies with extremely high funding (e.g., Uber) show lower ROI ratios due to high burn and operational expenses.
Industry Evolution and Trends
- Internet Software was the dominant sector for unicorn creation during the early 2010s.
- More recently, sectors like Artificial Intelligence, Blockchain, and HealthTech have gained momentum.
- Fintech remained resilient across all periods, consistently producing unicorns even during market downturns.
How to Reproduce
- Clone the repo:
git clone https://github.com/SebastianMarrero/Unicorn_SQL_Project.git - Run SQL scripts via MySQL Workbench
- Process data using Python (optional)
- Build visualizations using Tableau Public
For full documentation, see the project's README on GitHub.