SaaS Customer Churn Analysis
End-to-end analysis of customer churn using a fictional SaaS dataset. This project combines exploratory data analysis, model development, and interpretability techniques to identify key churn drivers and propose data-backed retention strategies.
Project Overview
Purpose
- Identify behavioral and usage-based predictors of churn.
- Compare interpretable and ensemble models for prediction performance.
- Extract actionable insights to inform customer success and engagement.
Dataset & Tools
- Data Source: Kaggle’s SaaS Churn Dataset
- Tech Stack: Python (pandas, matplotlib, seaborn, scikit-learn), Jupyter Notebook
- Deployment: GitHub Pages + Jekyll
Key Business Questions
- What features best predict whether a SaaS customer will churn?
- How do behavior metrics like support calls, payment delays, and inactivity relate to churn?
- Which model provides the best trade-off between interpretability and accuracy?
Data Visualizations
Churn by Subscription Type
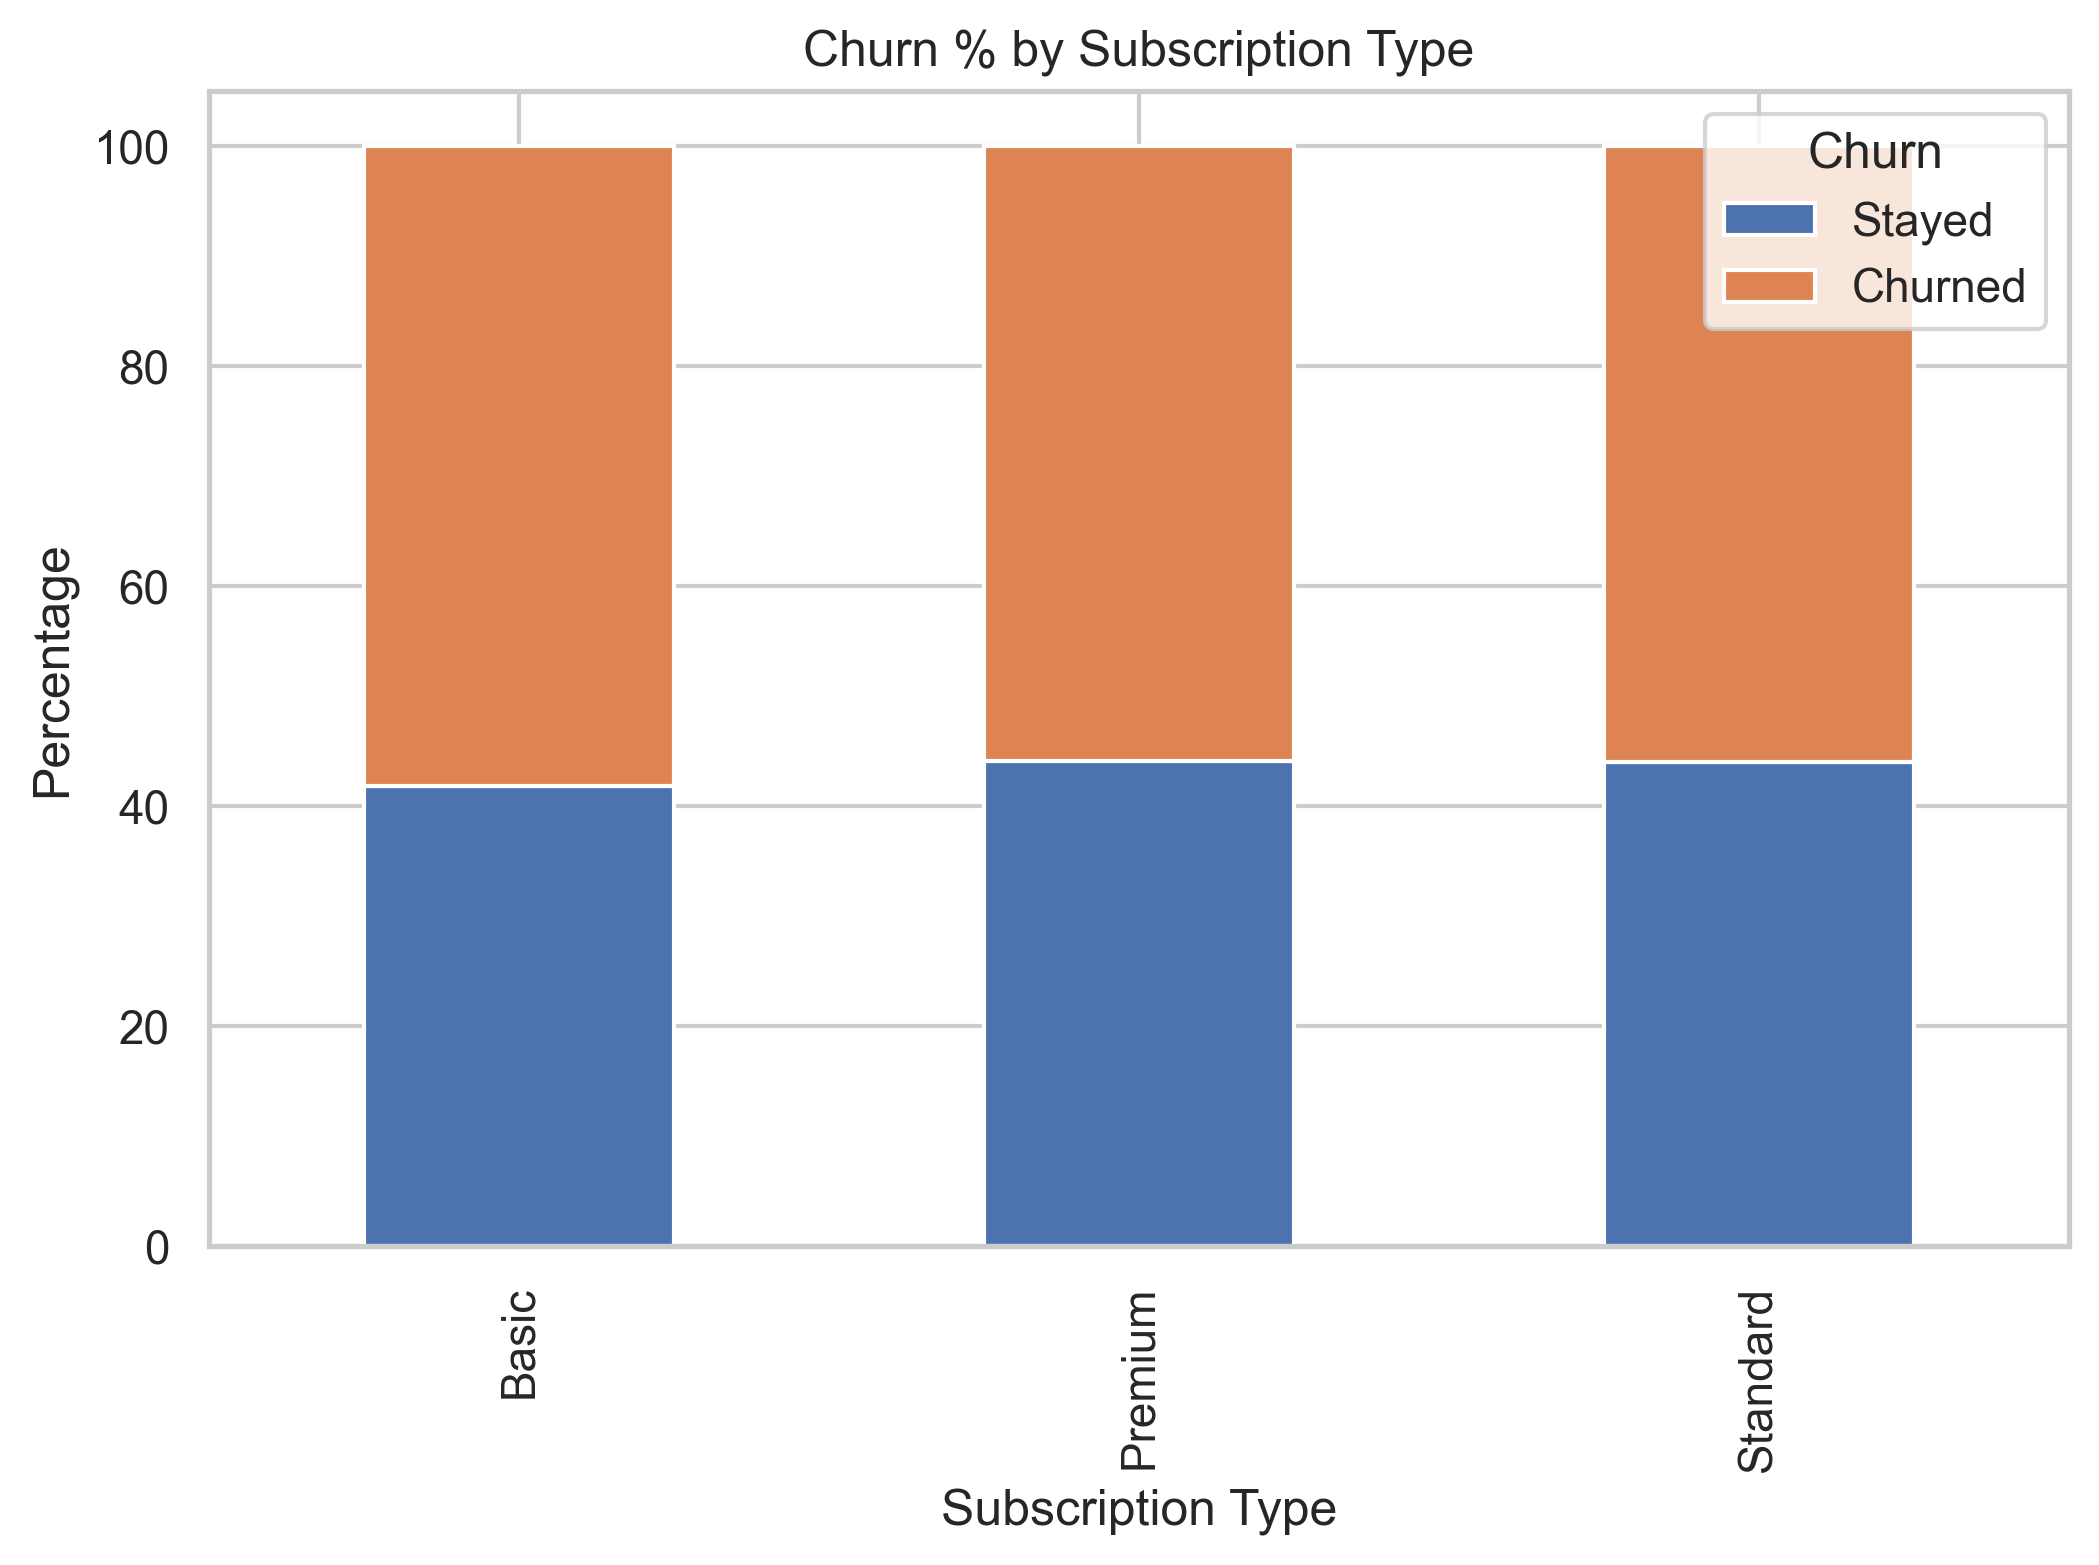
- Basic plan users showed slightly higher churn than Premium/Standard users.
- Upselling strategies to retain lower-tier customers may help reduce churn.
Churn by Contract Length
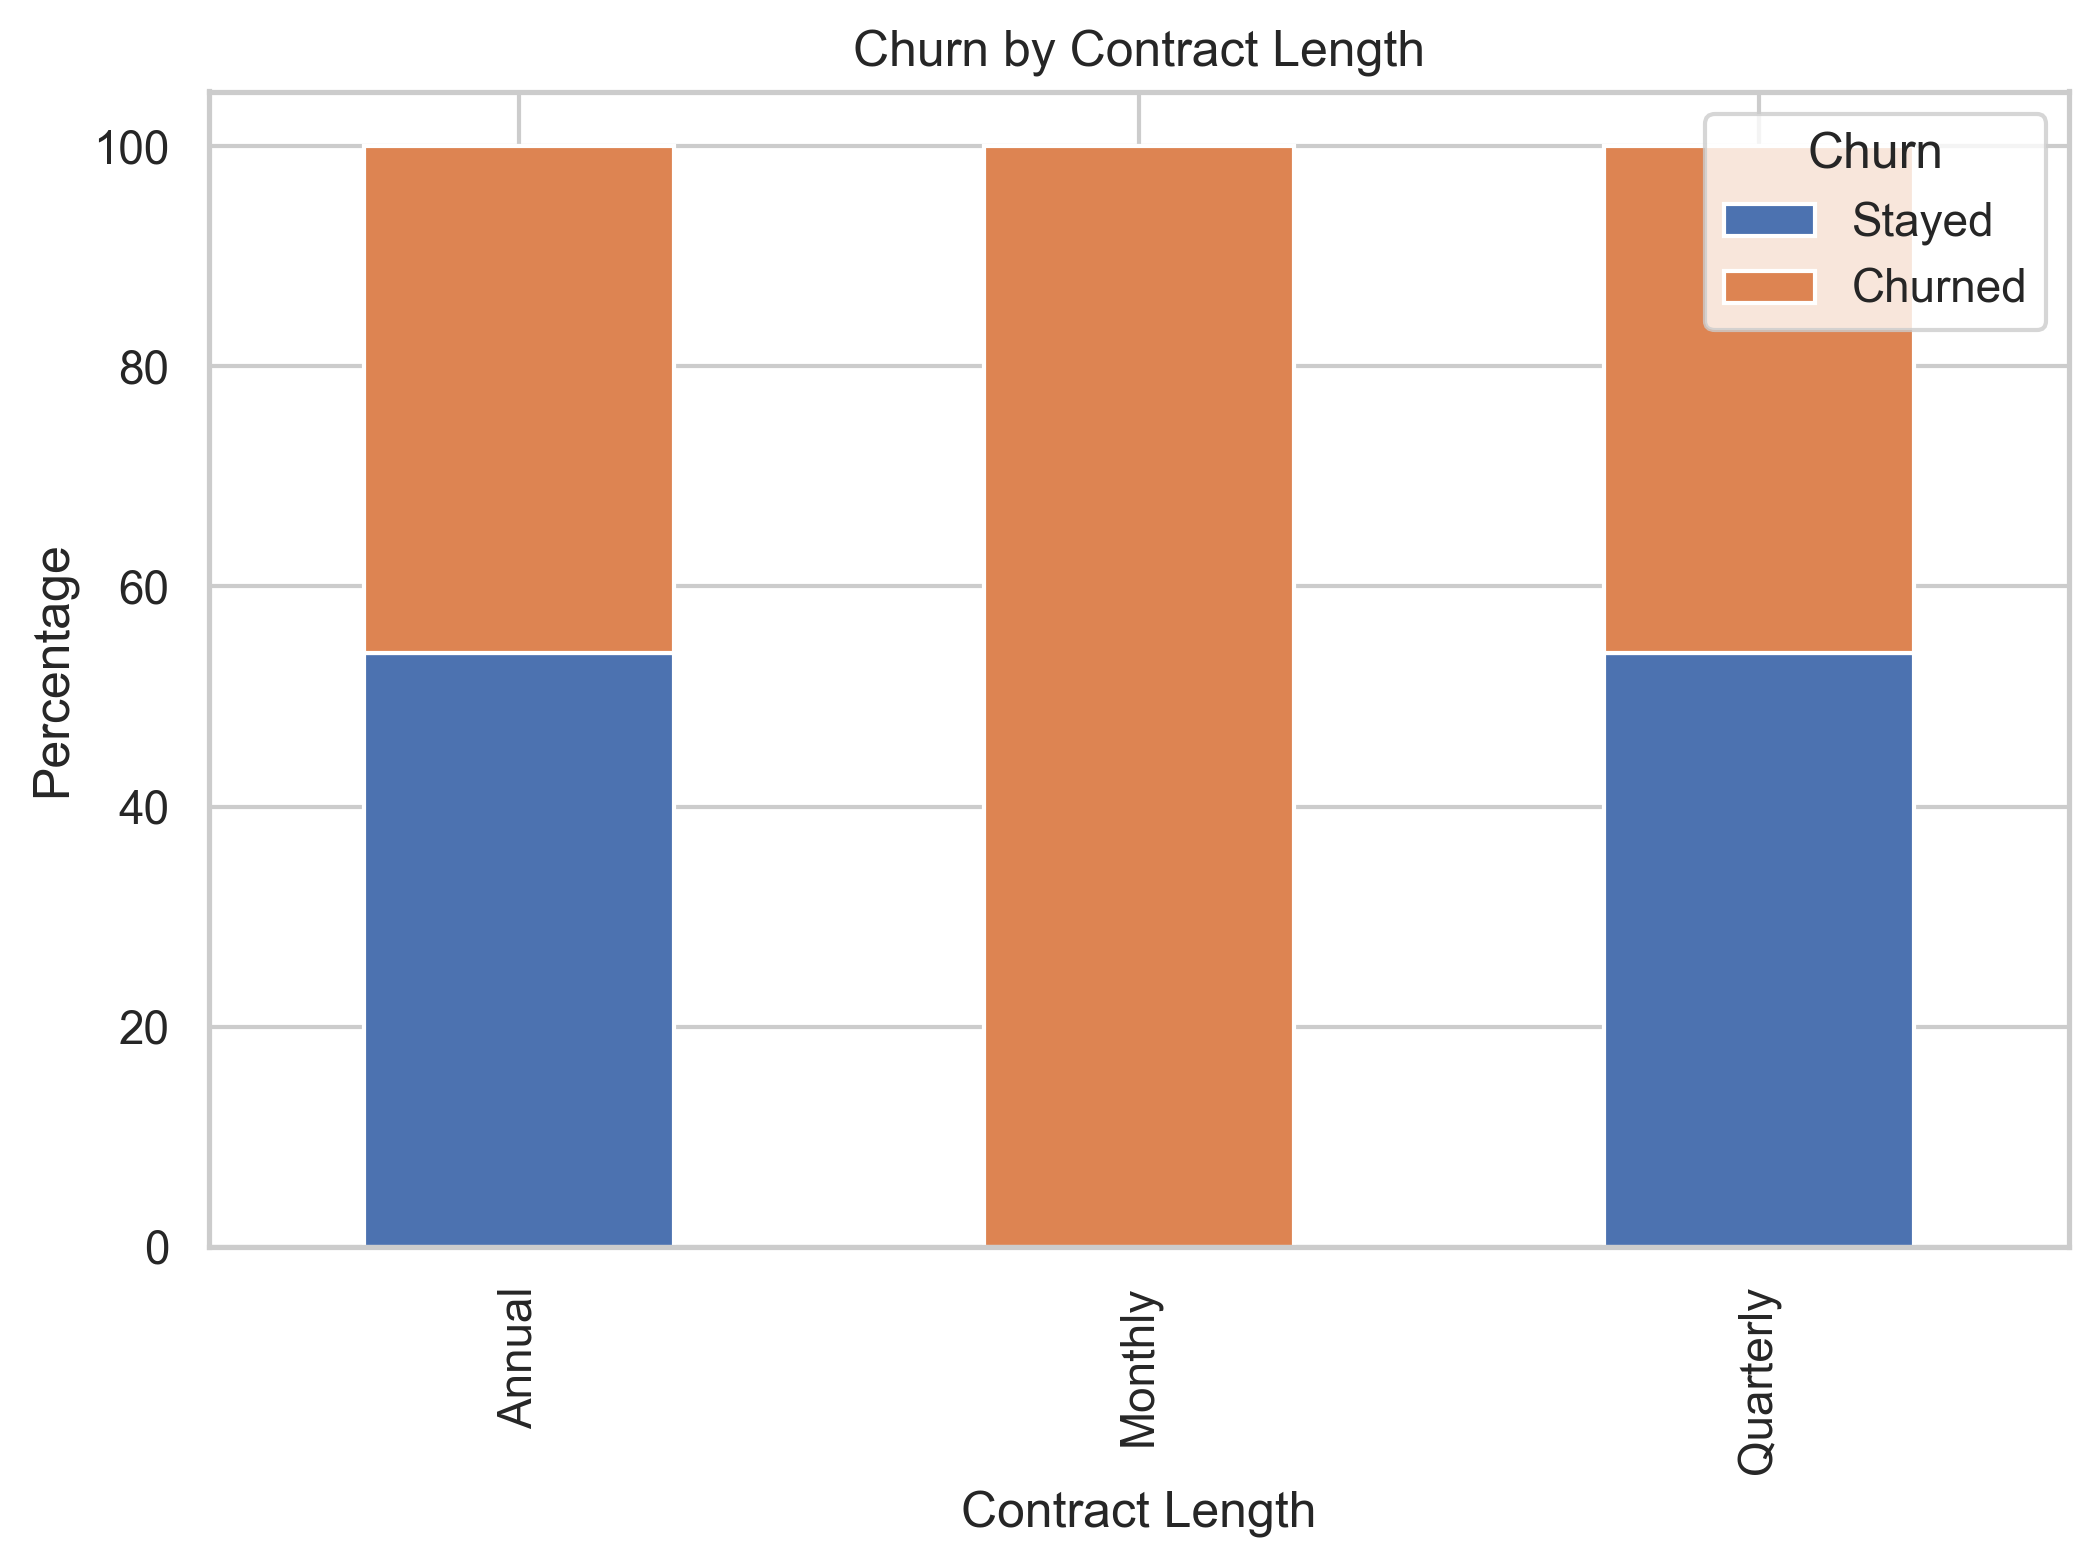
- Quarterly contracts had highest churn rates.
- Annual plans promote loyalty—an opportunity for longer-term commitment strategies.
Tenure by Churn Status
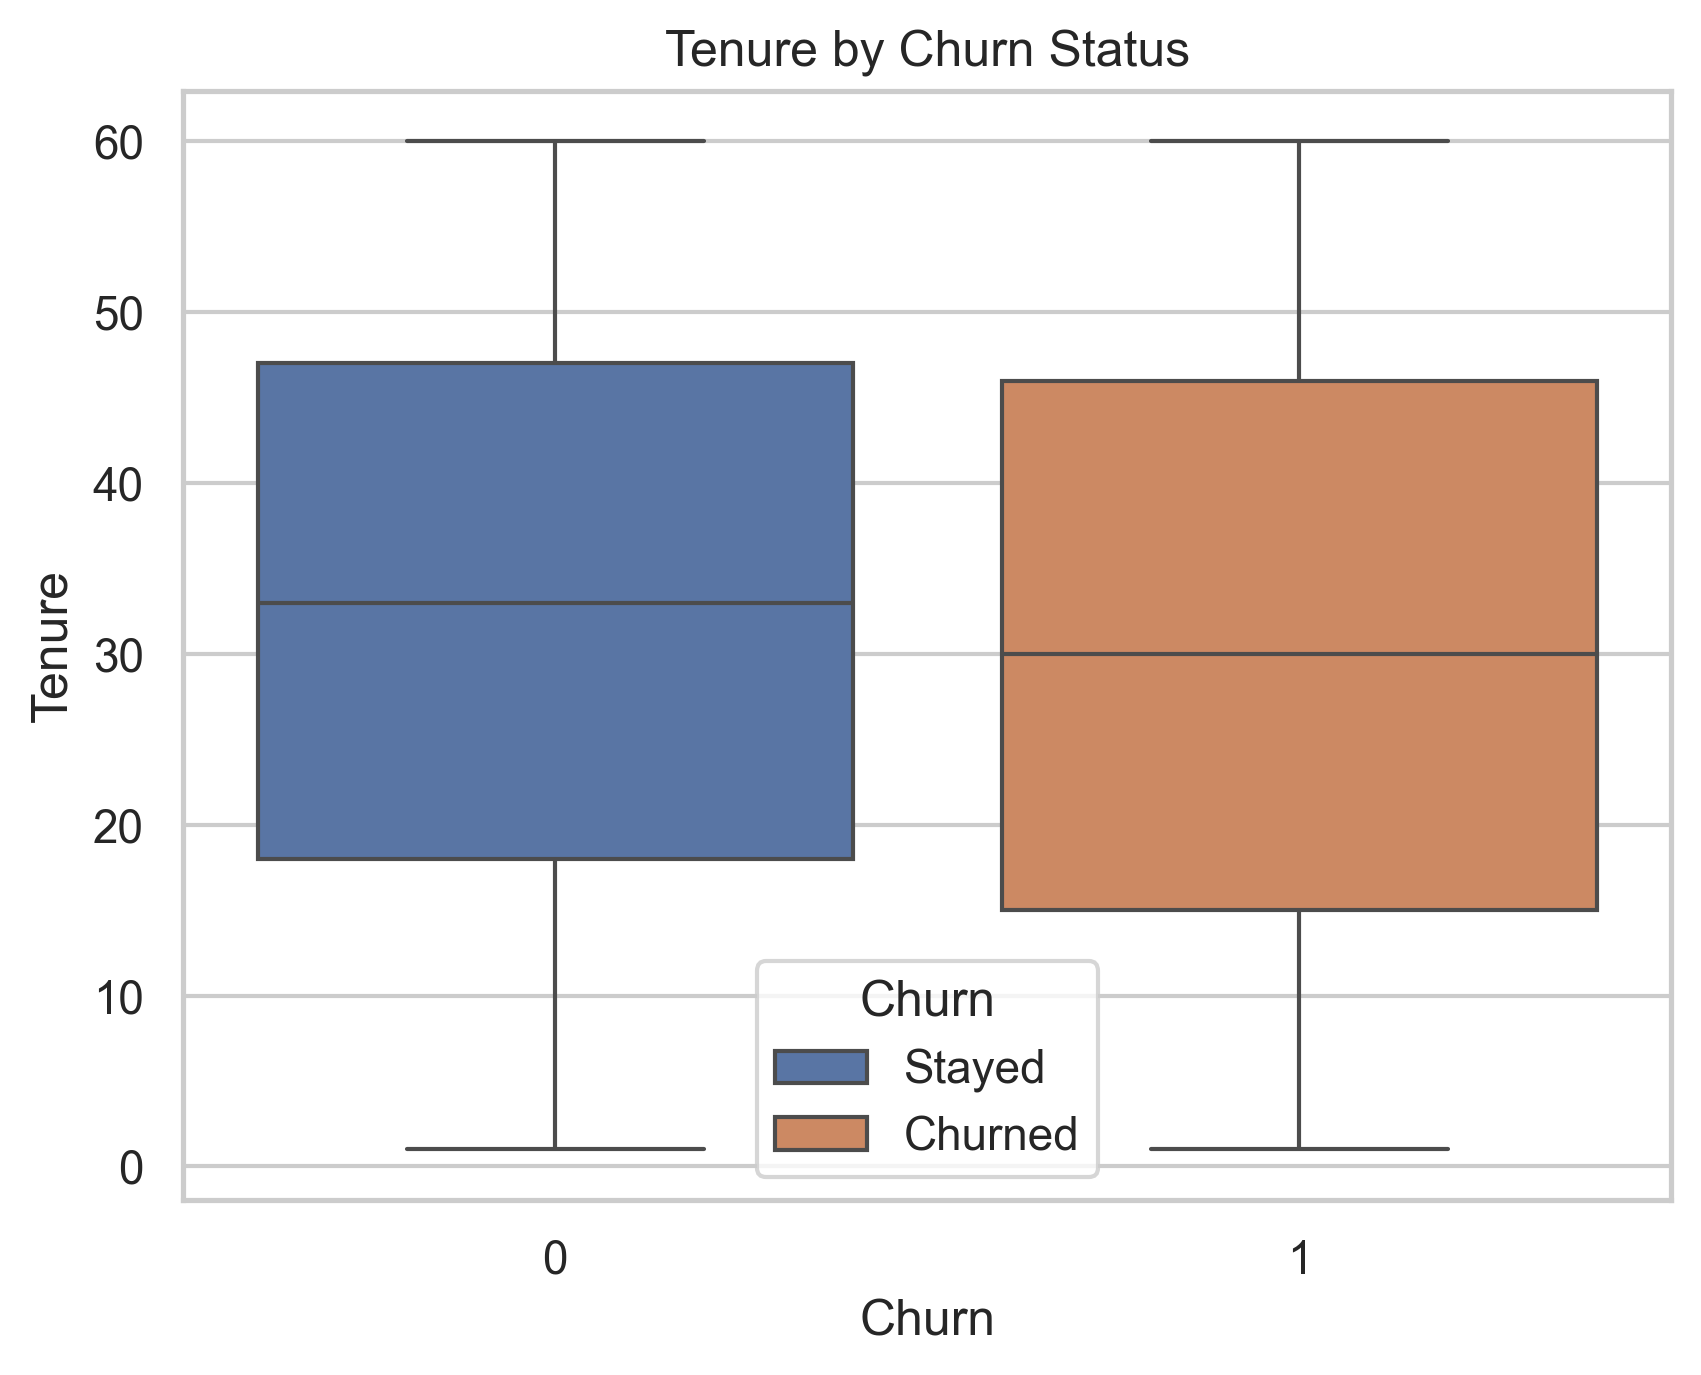
- Shorter-tenure users were more likely to churn.
- Highlights importance of early-stage engagement and onboarding efforts.
Support Calls by Churn Status
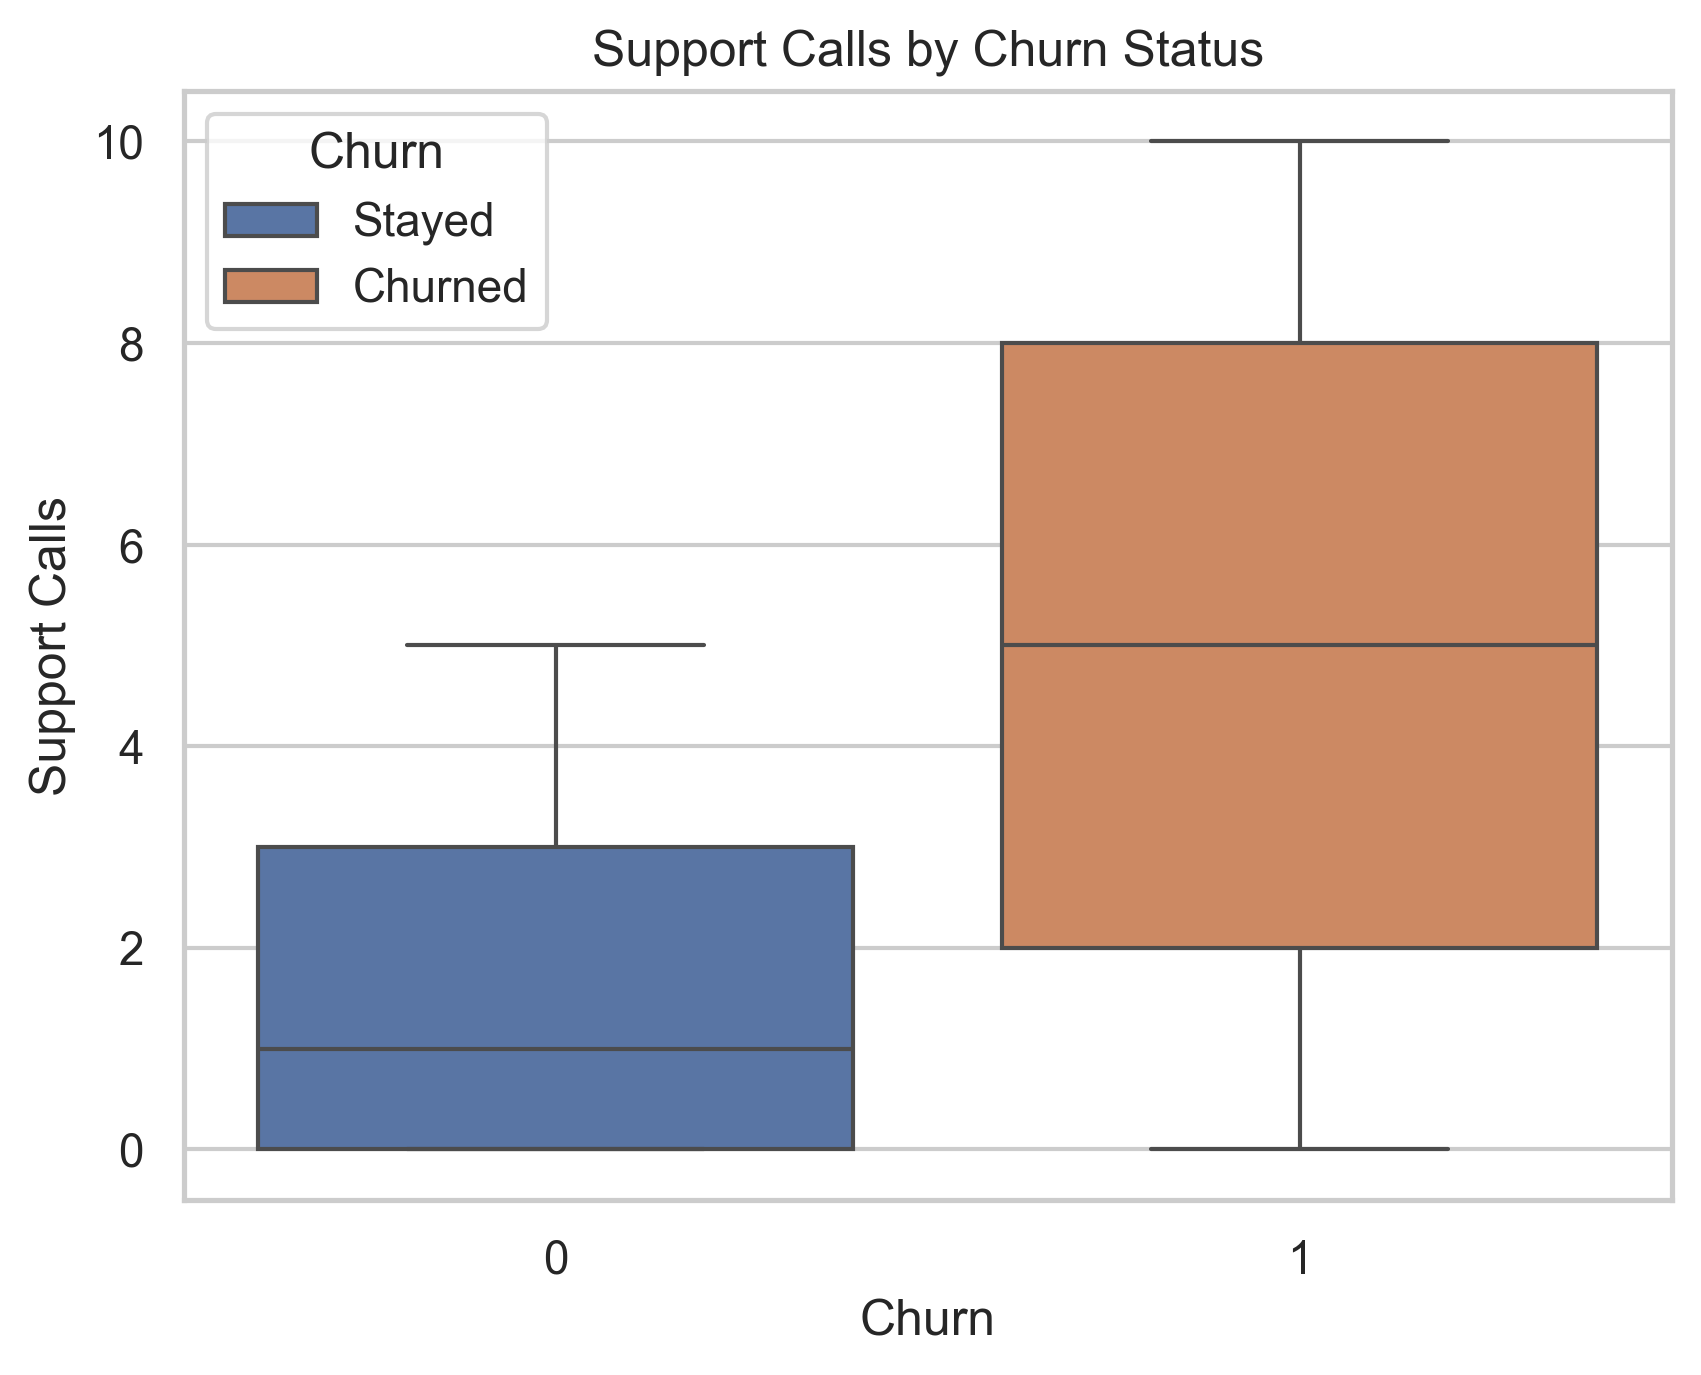
- Churners placed more support calls, indicating frustration or dissatisfaction.
Last Interaction by Churn Status
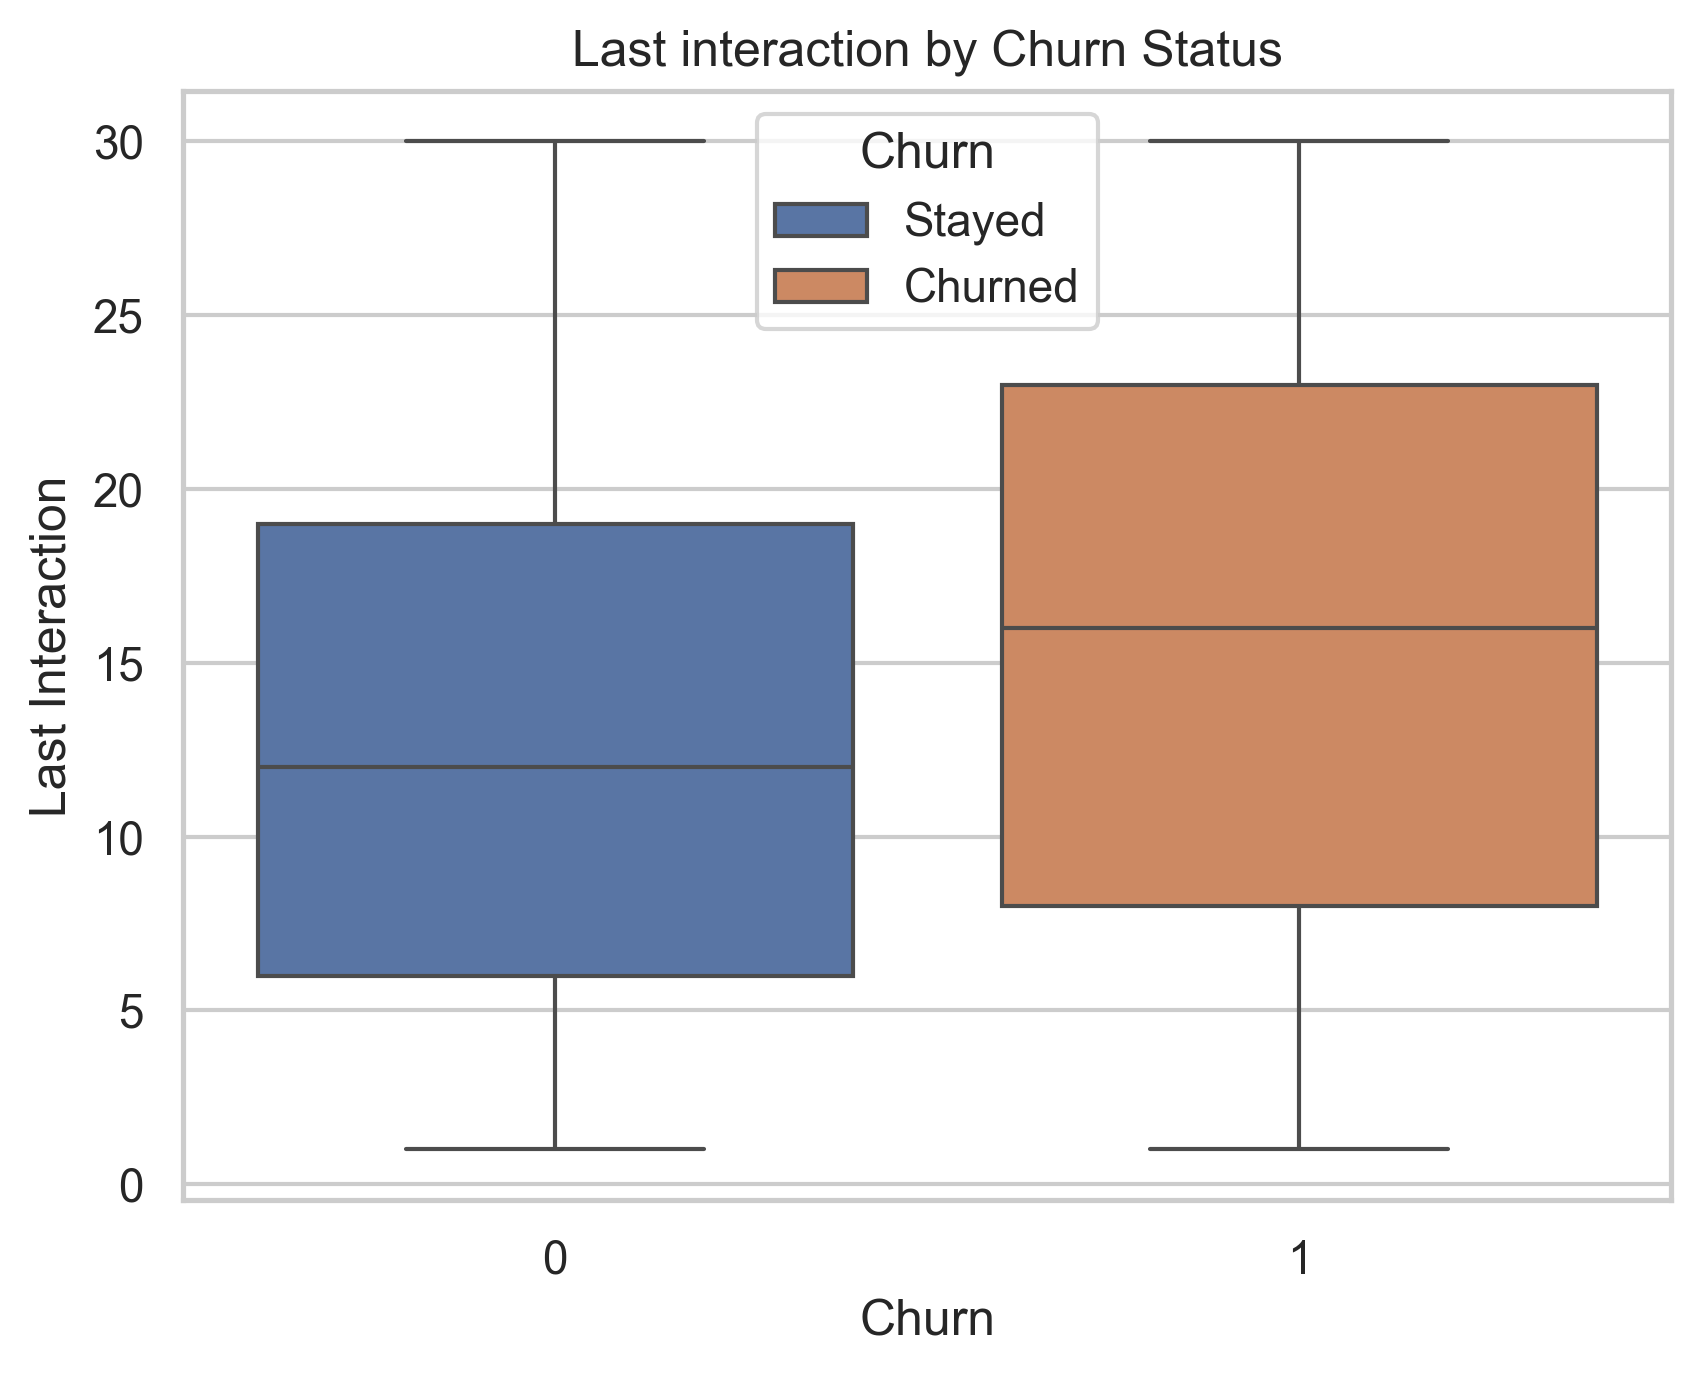
- Churners tended to show longer periods of inactivity before leaving.
Modeling Results
Model Performance Summary
| Model | AUC | Accuracy | Churn Recall | Stay Recall |
|---|---|---|---|---|
| Logistic Regression | 0.79 | 71% | 77% | 67% |
| Random Forest (Default) | 0.62 | 50% | 95% | 22% |
| Random Forest (Tuned) | 0.68 | 56% | 93% | 25% |
ROC Curve Comparison
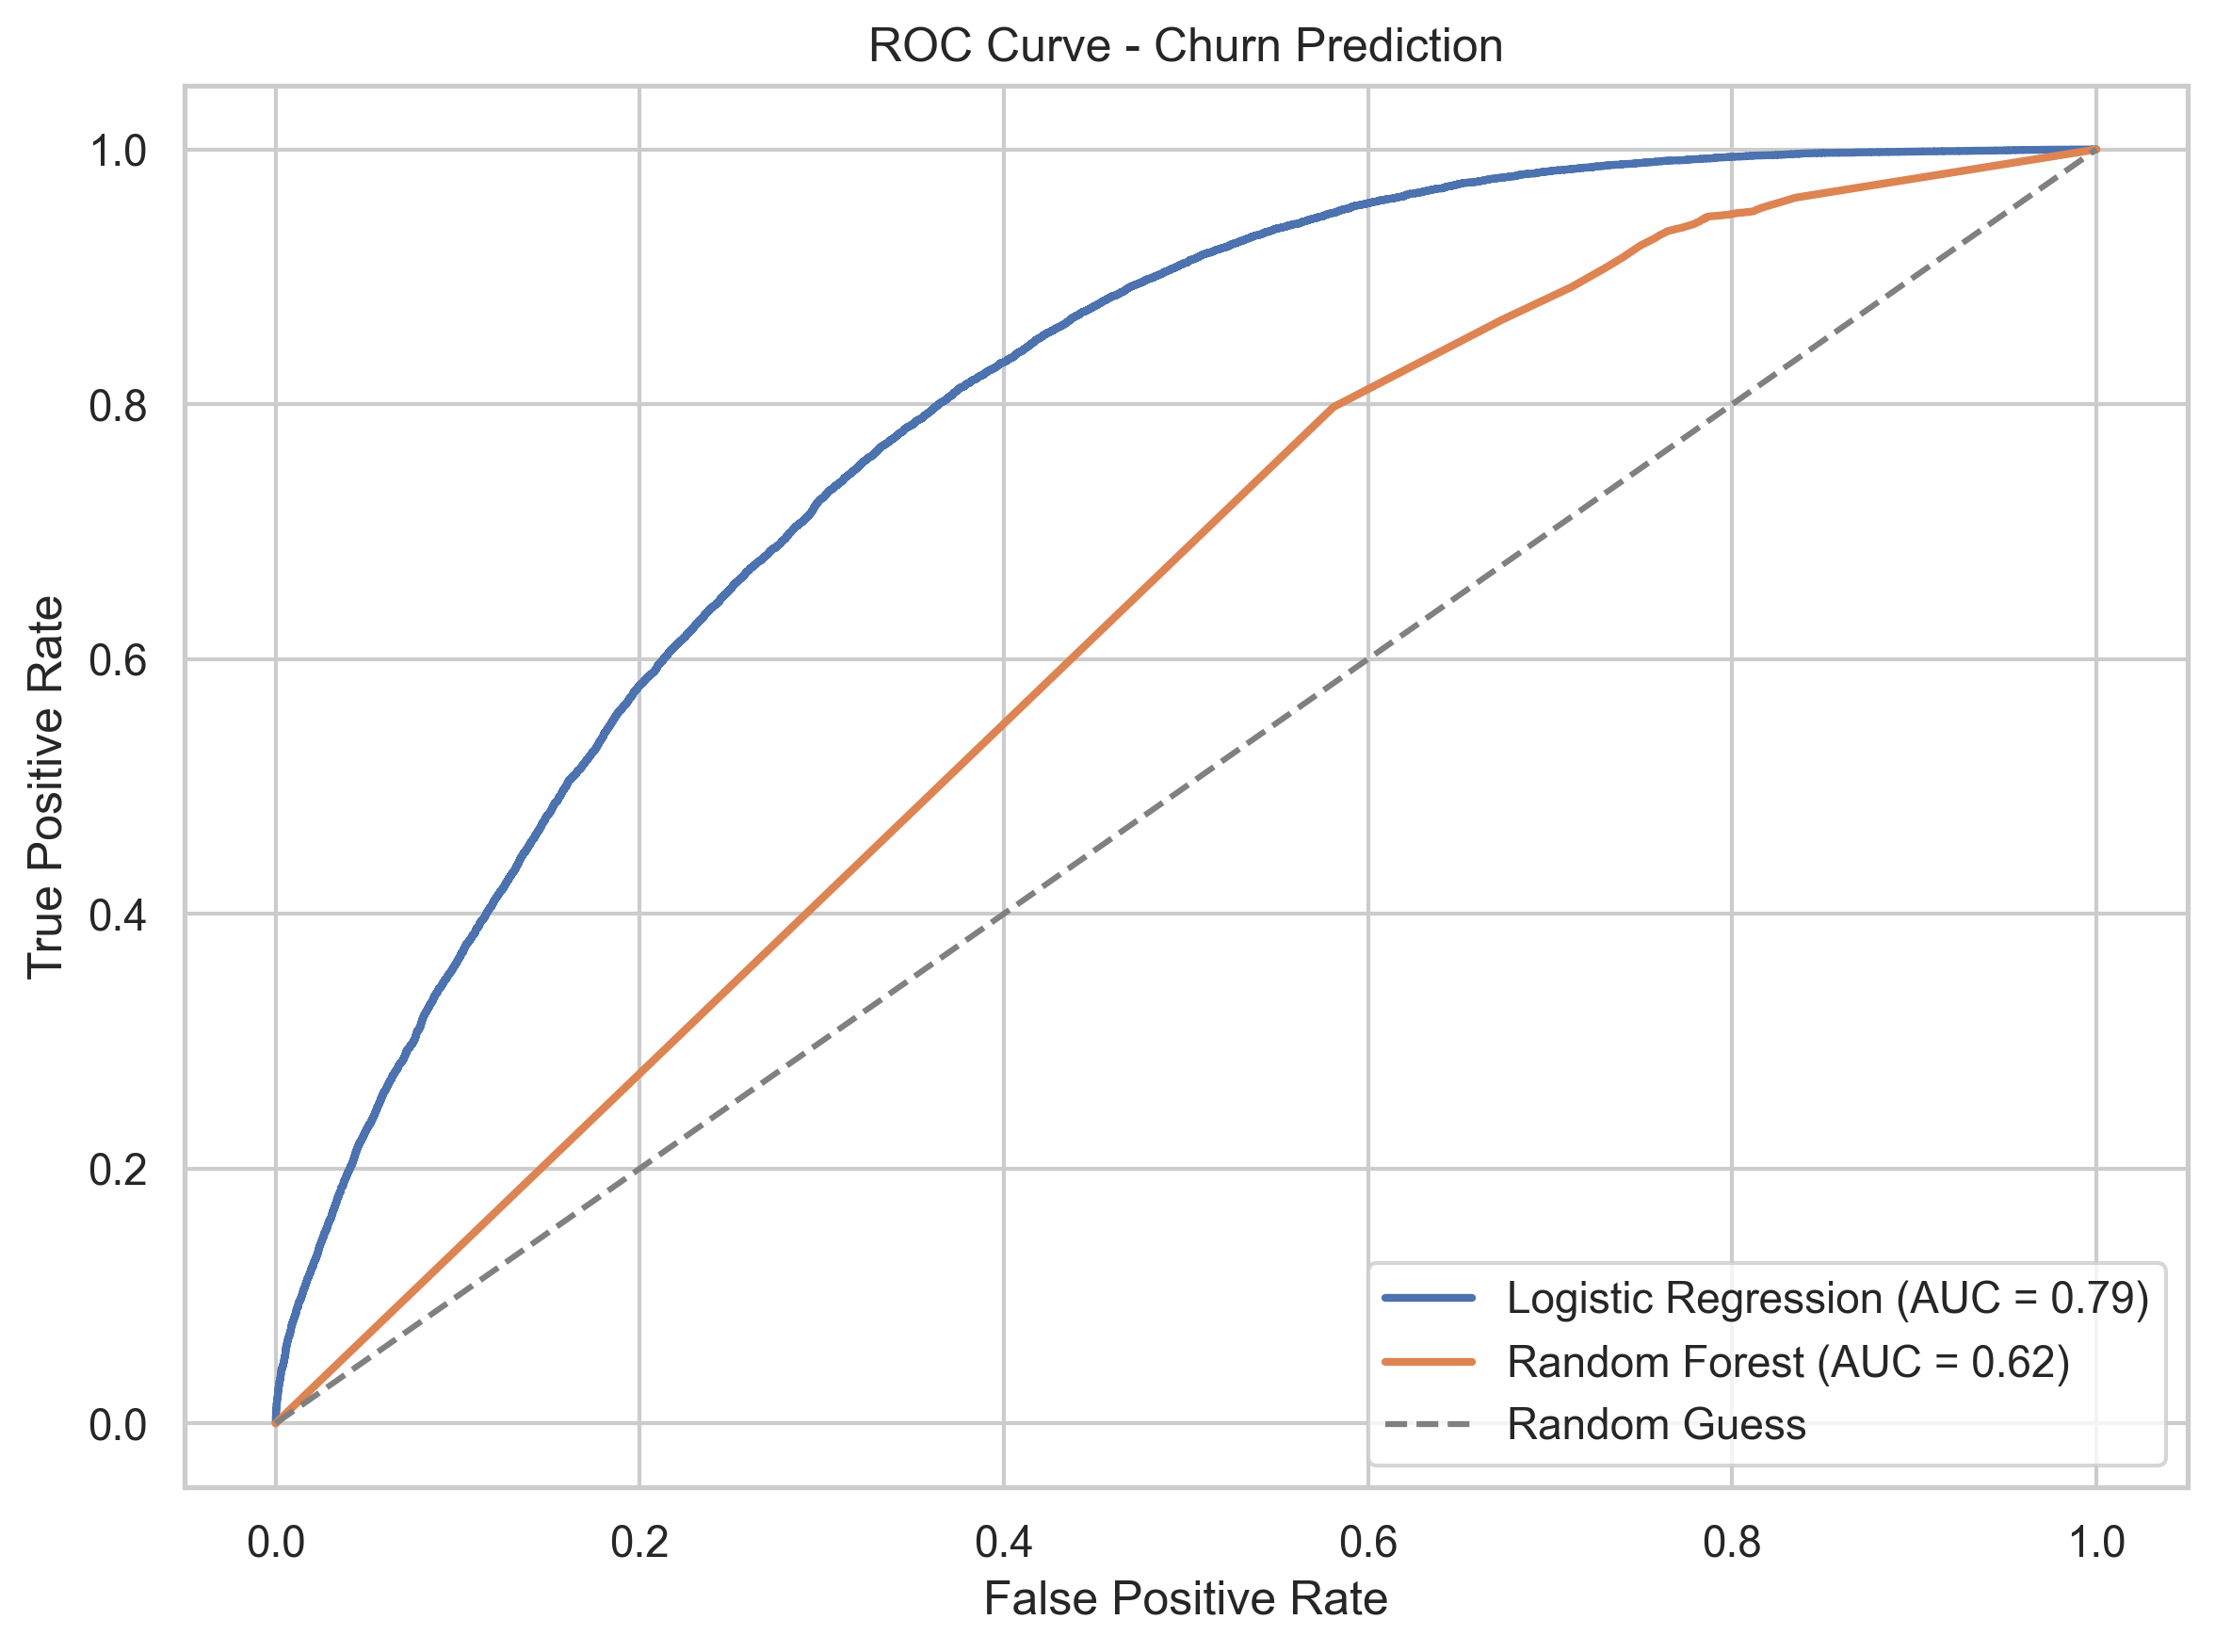
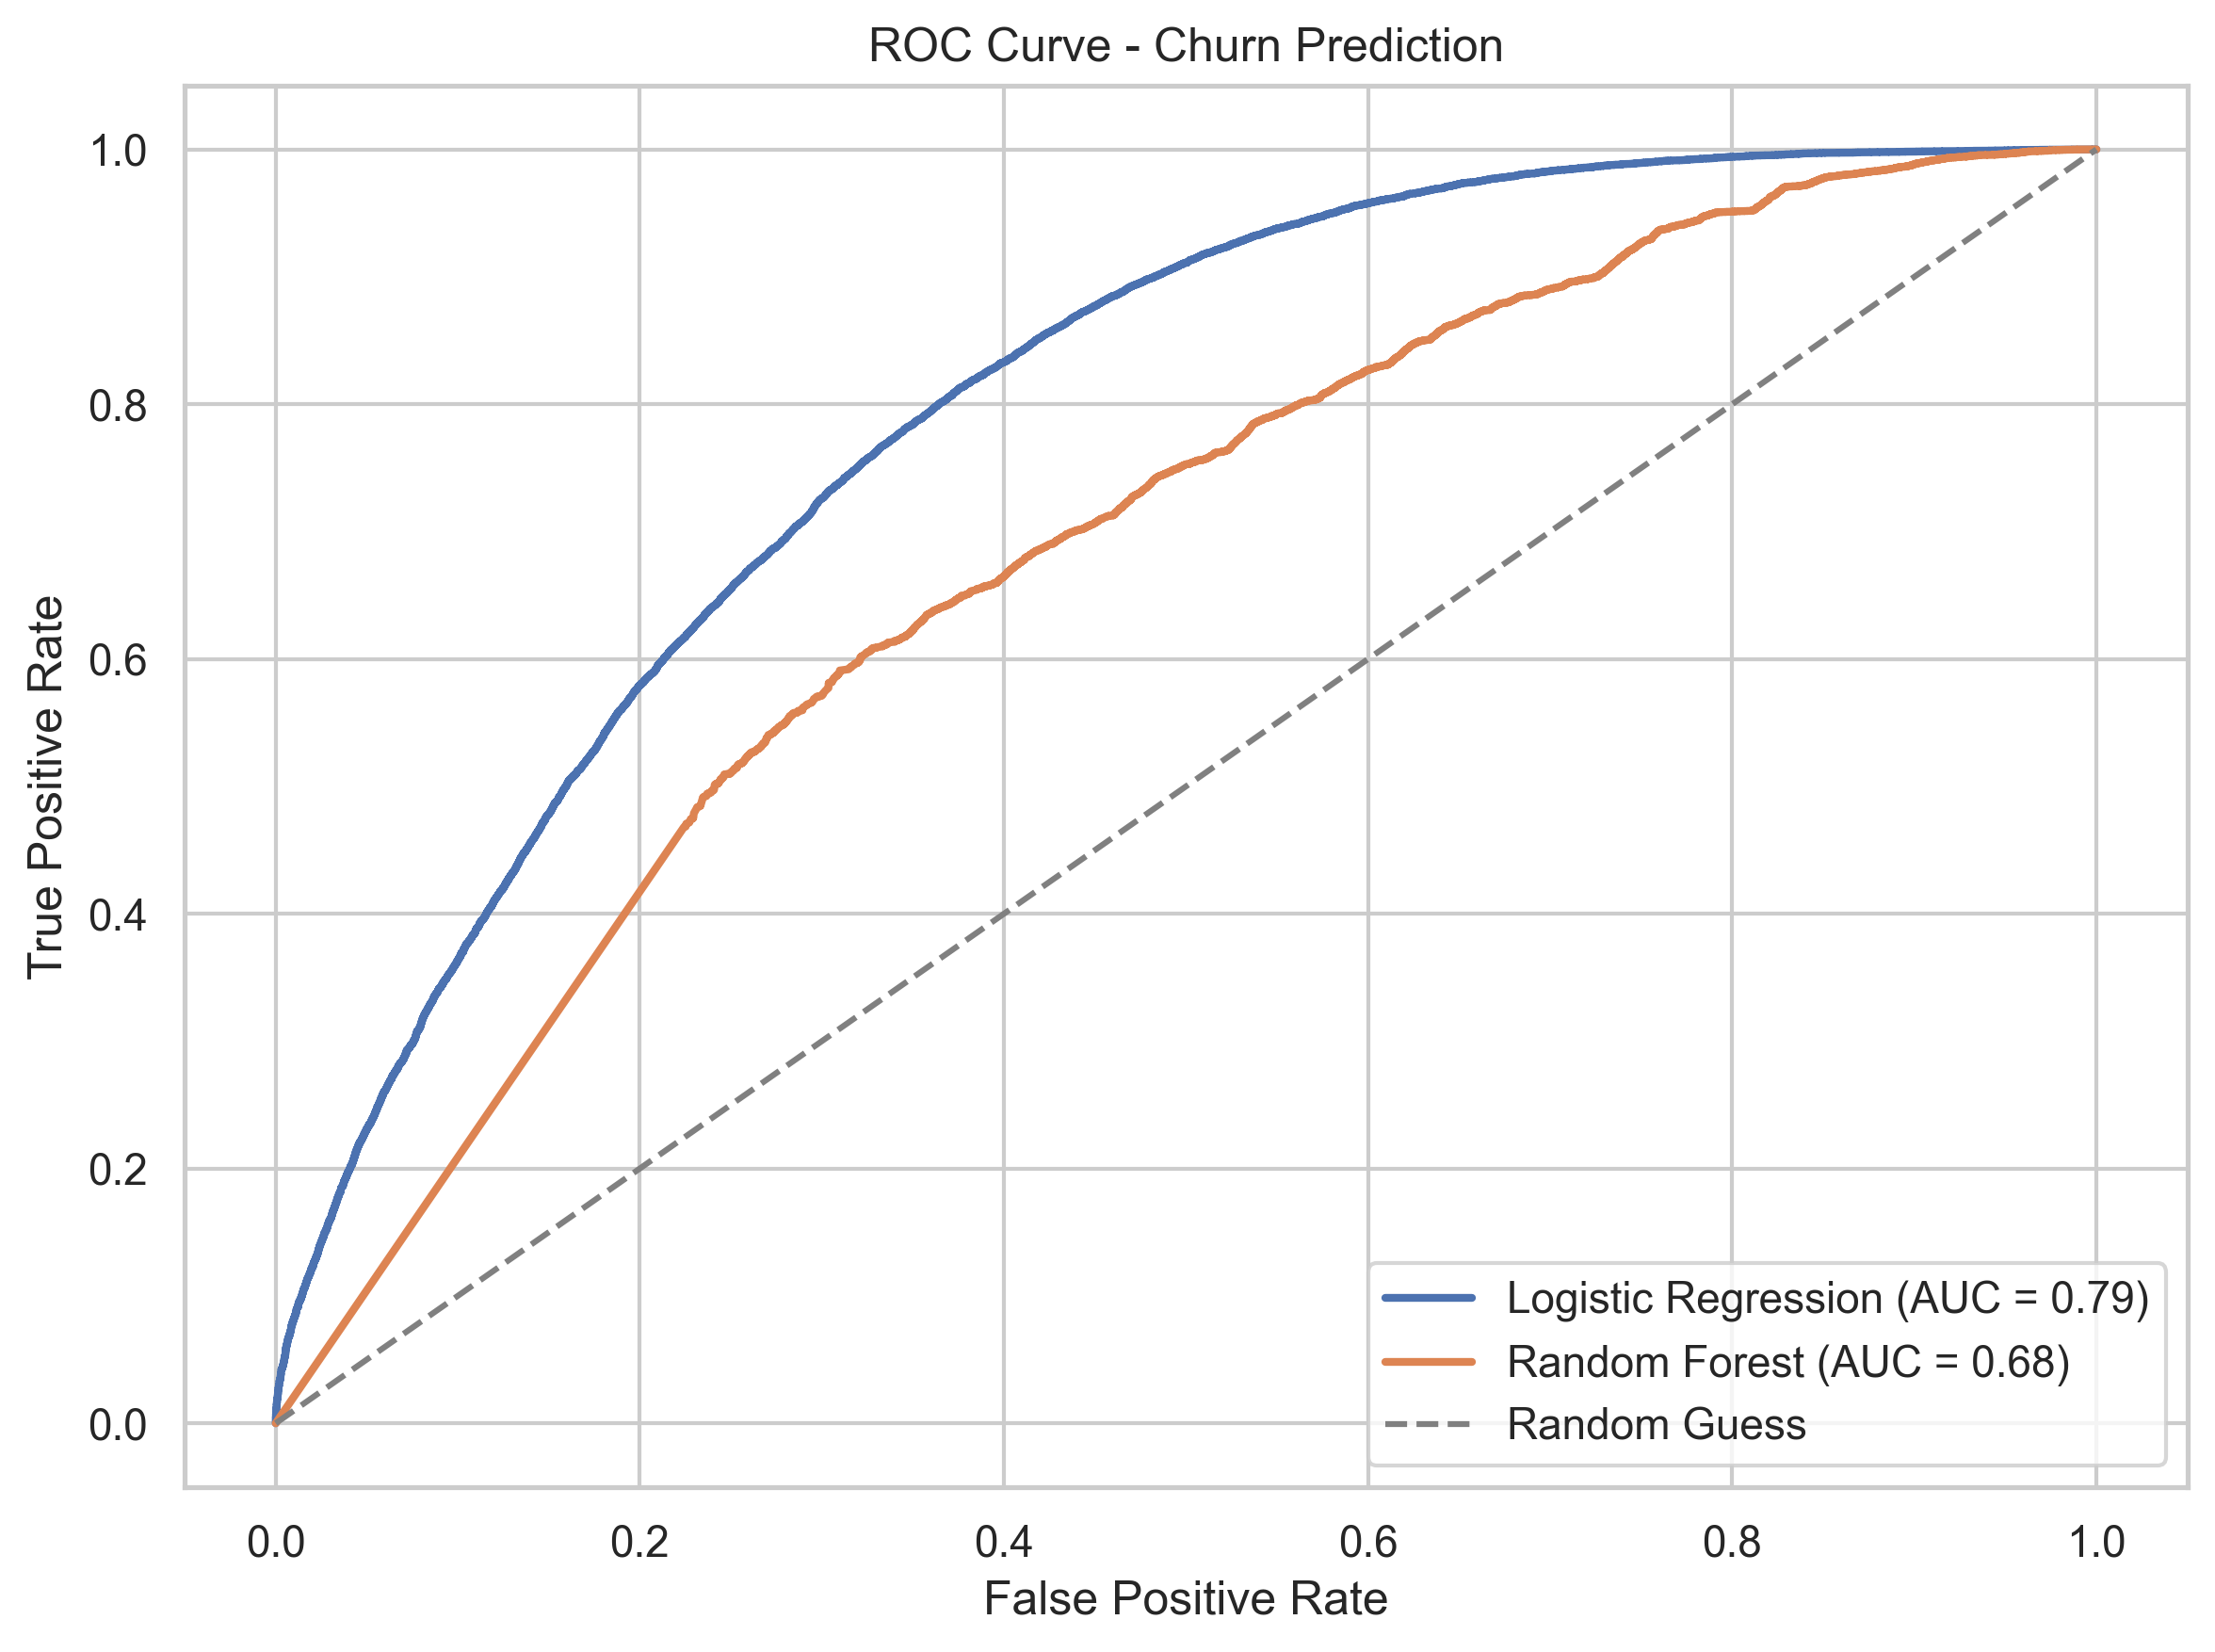
- Logistic Regression outperforms both default and tuned Random Forest models.
- Tuning improved RF performance, but Logistic Regression remained most reliable.
Feature Importance (Random Forest)
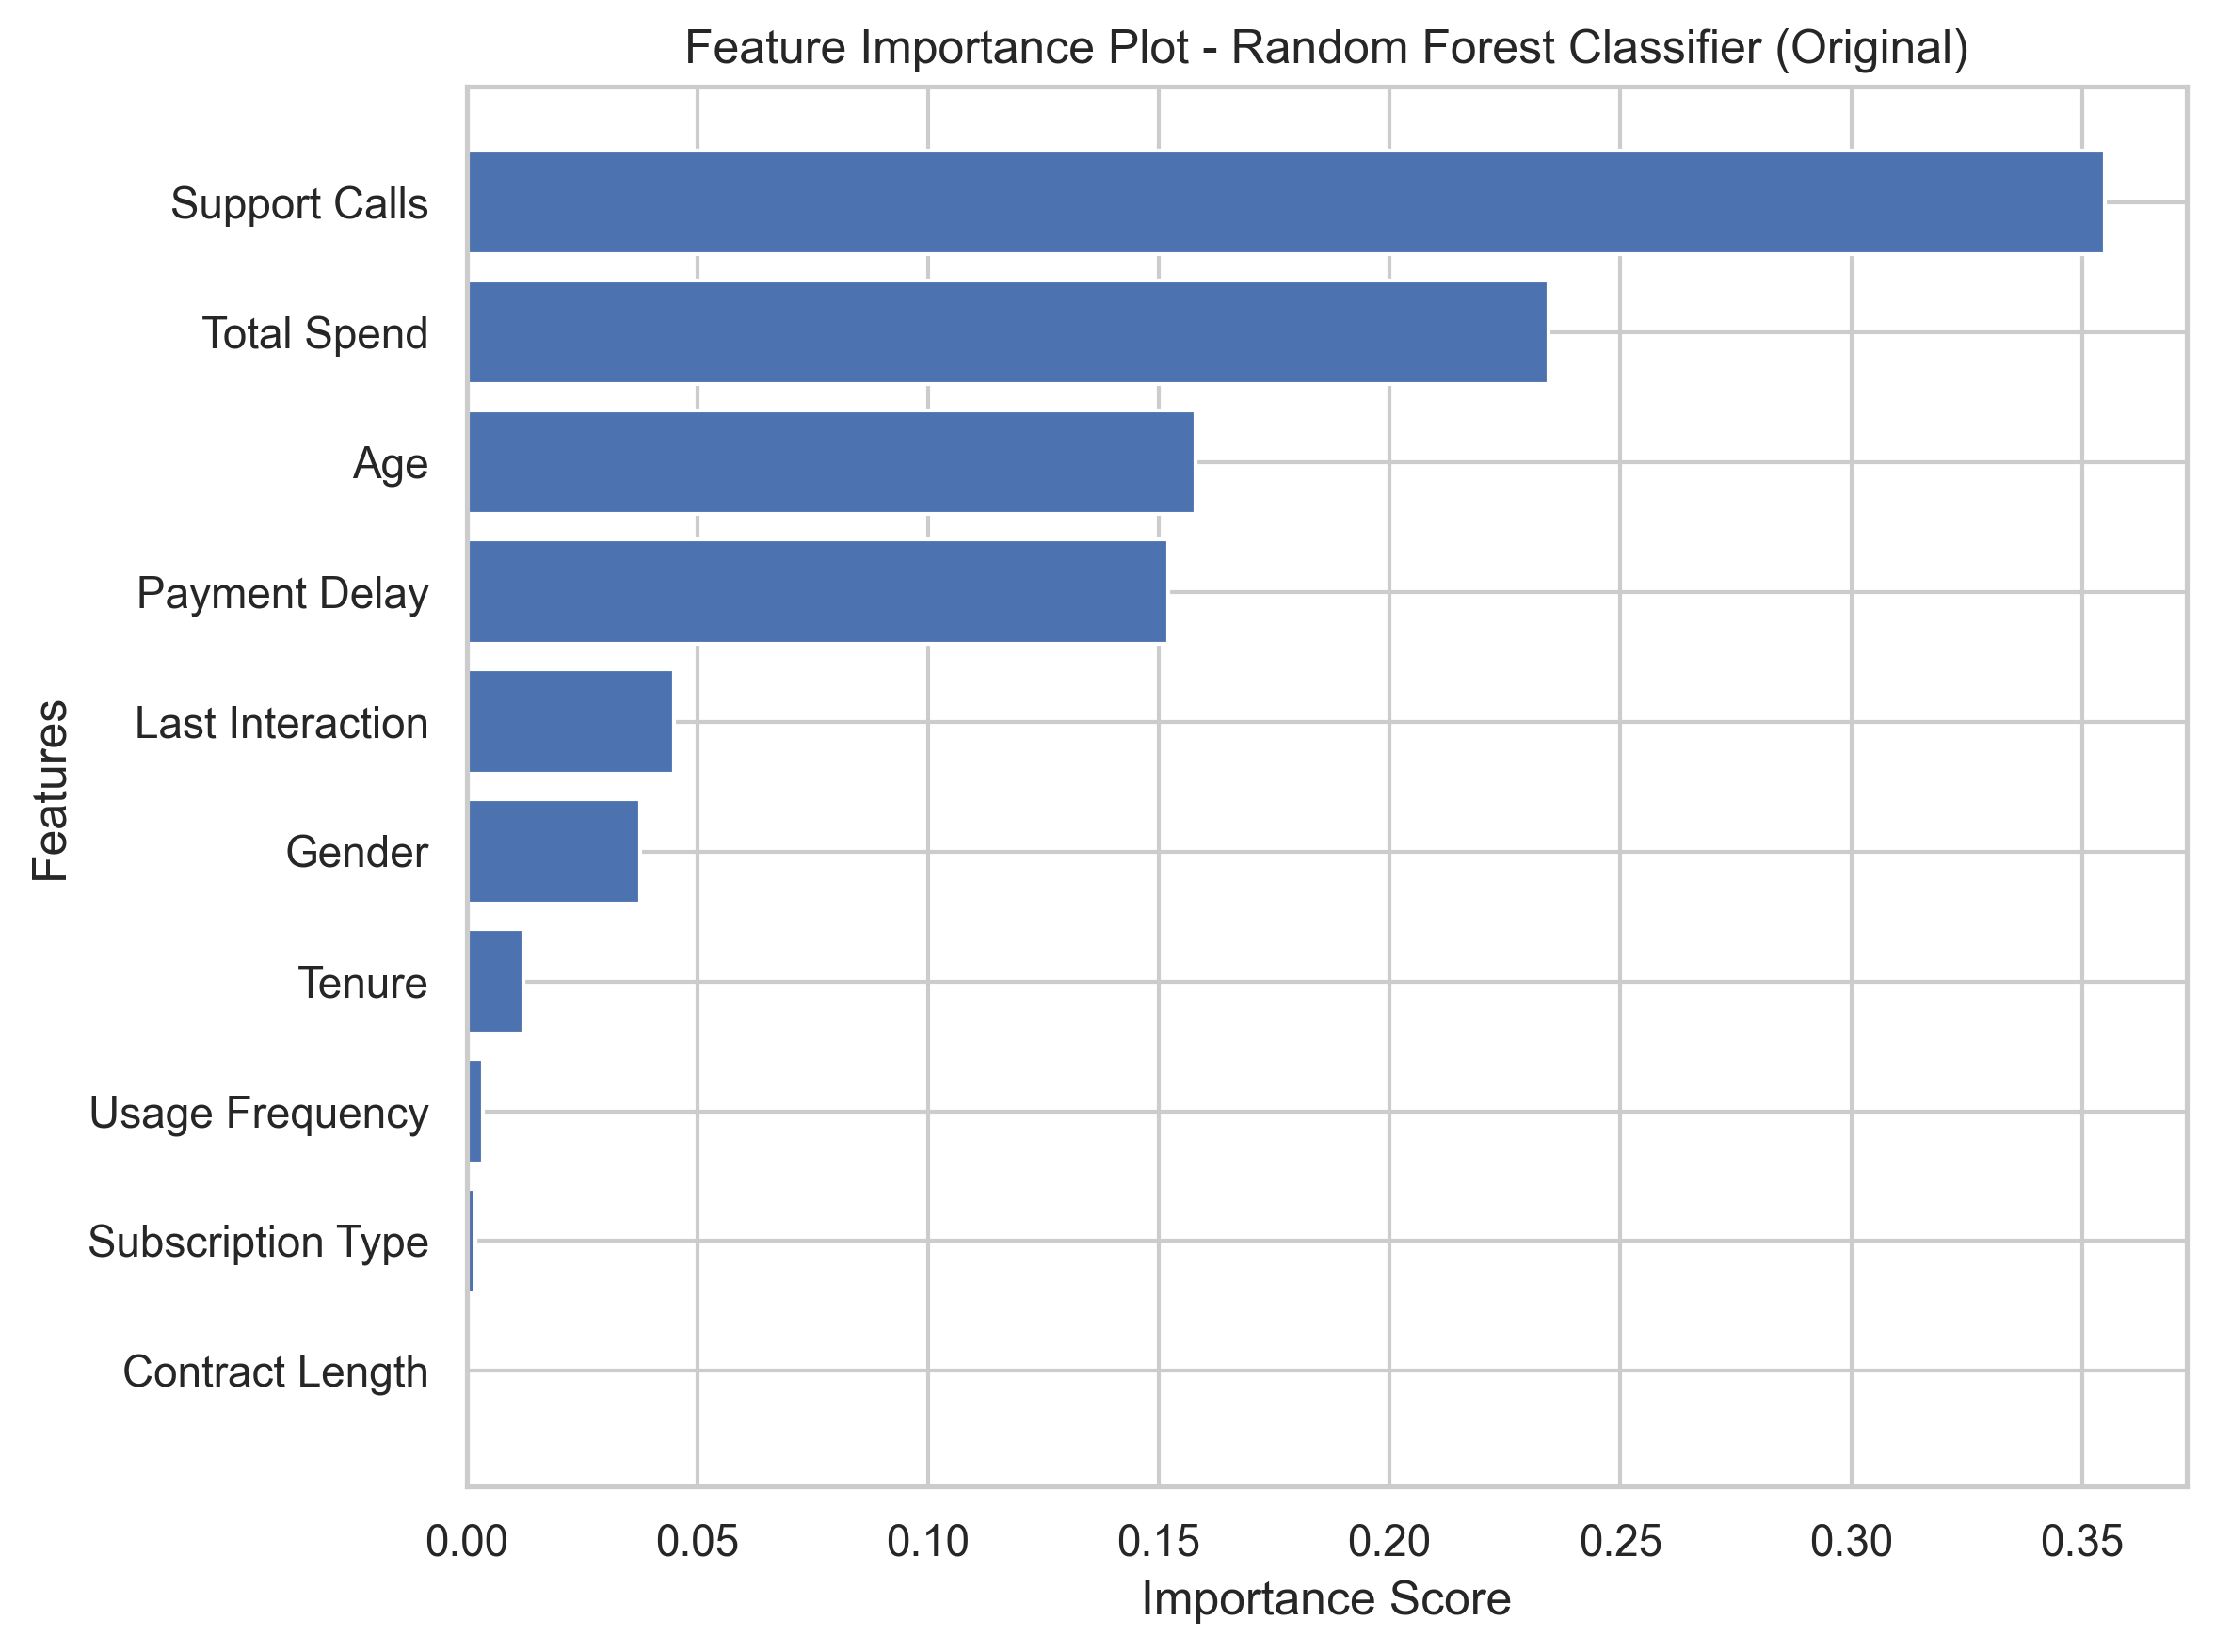
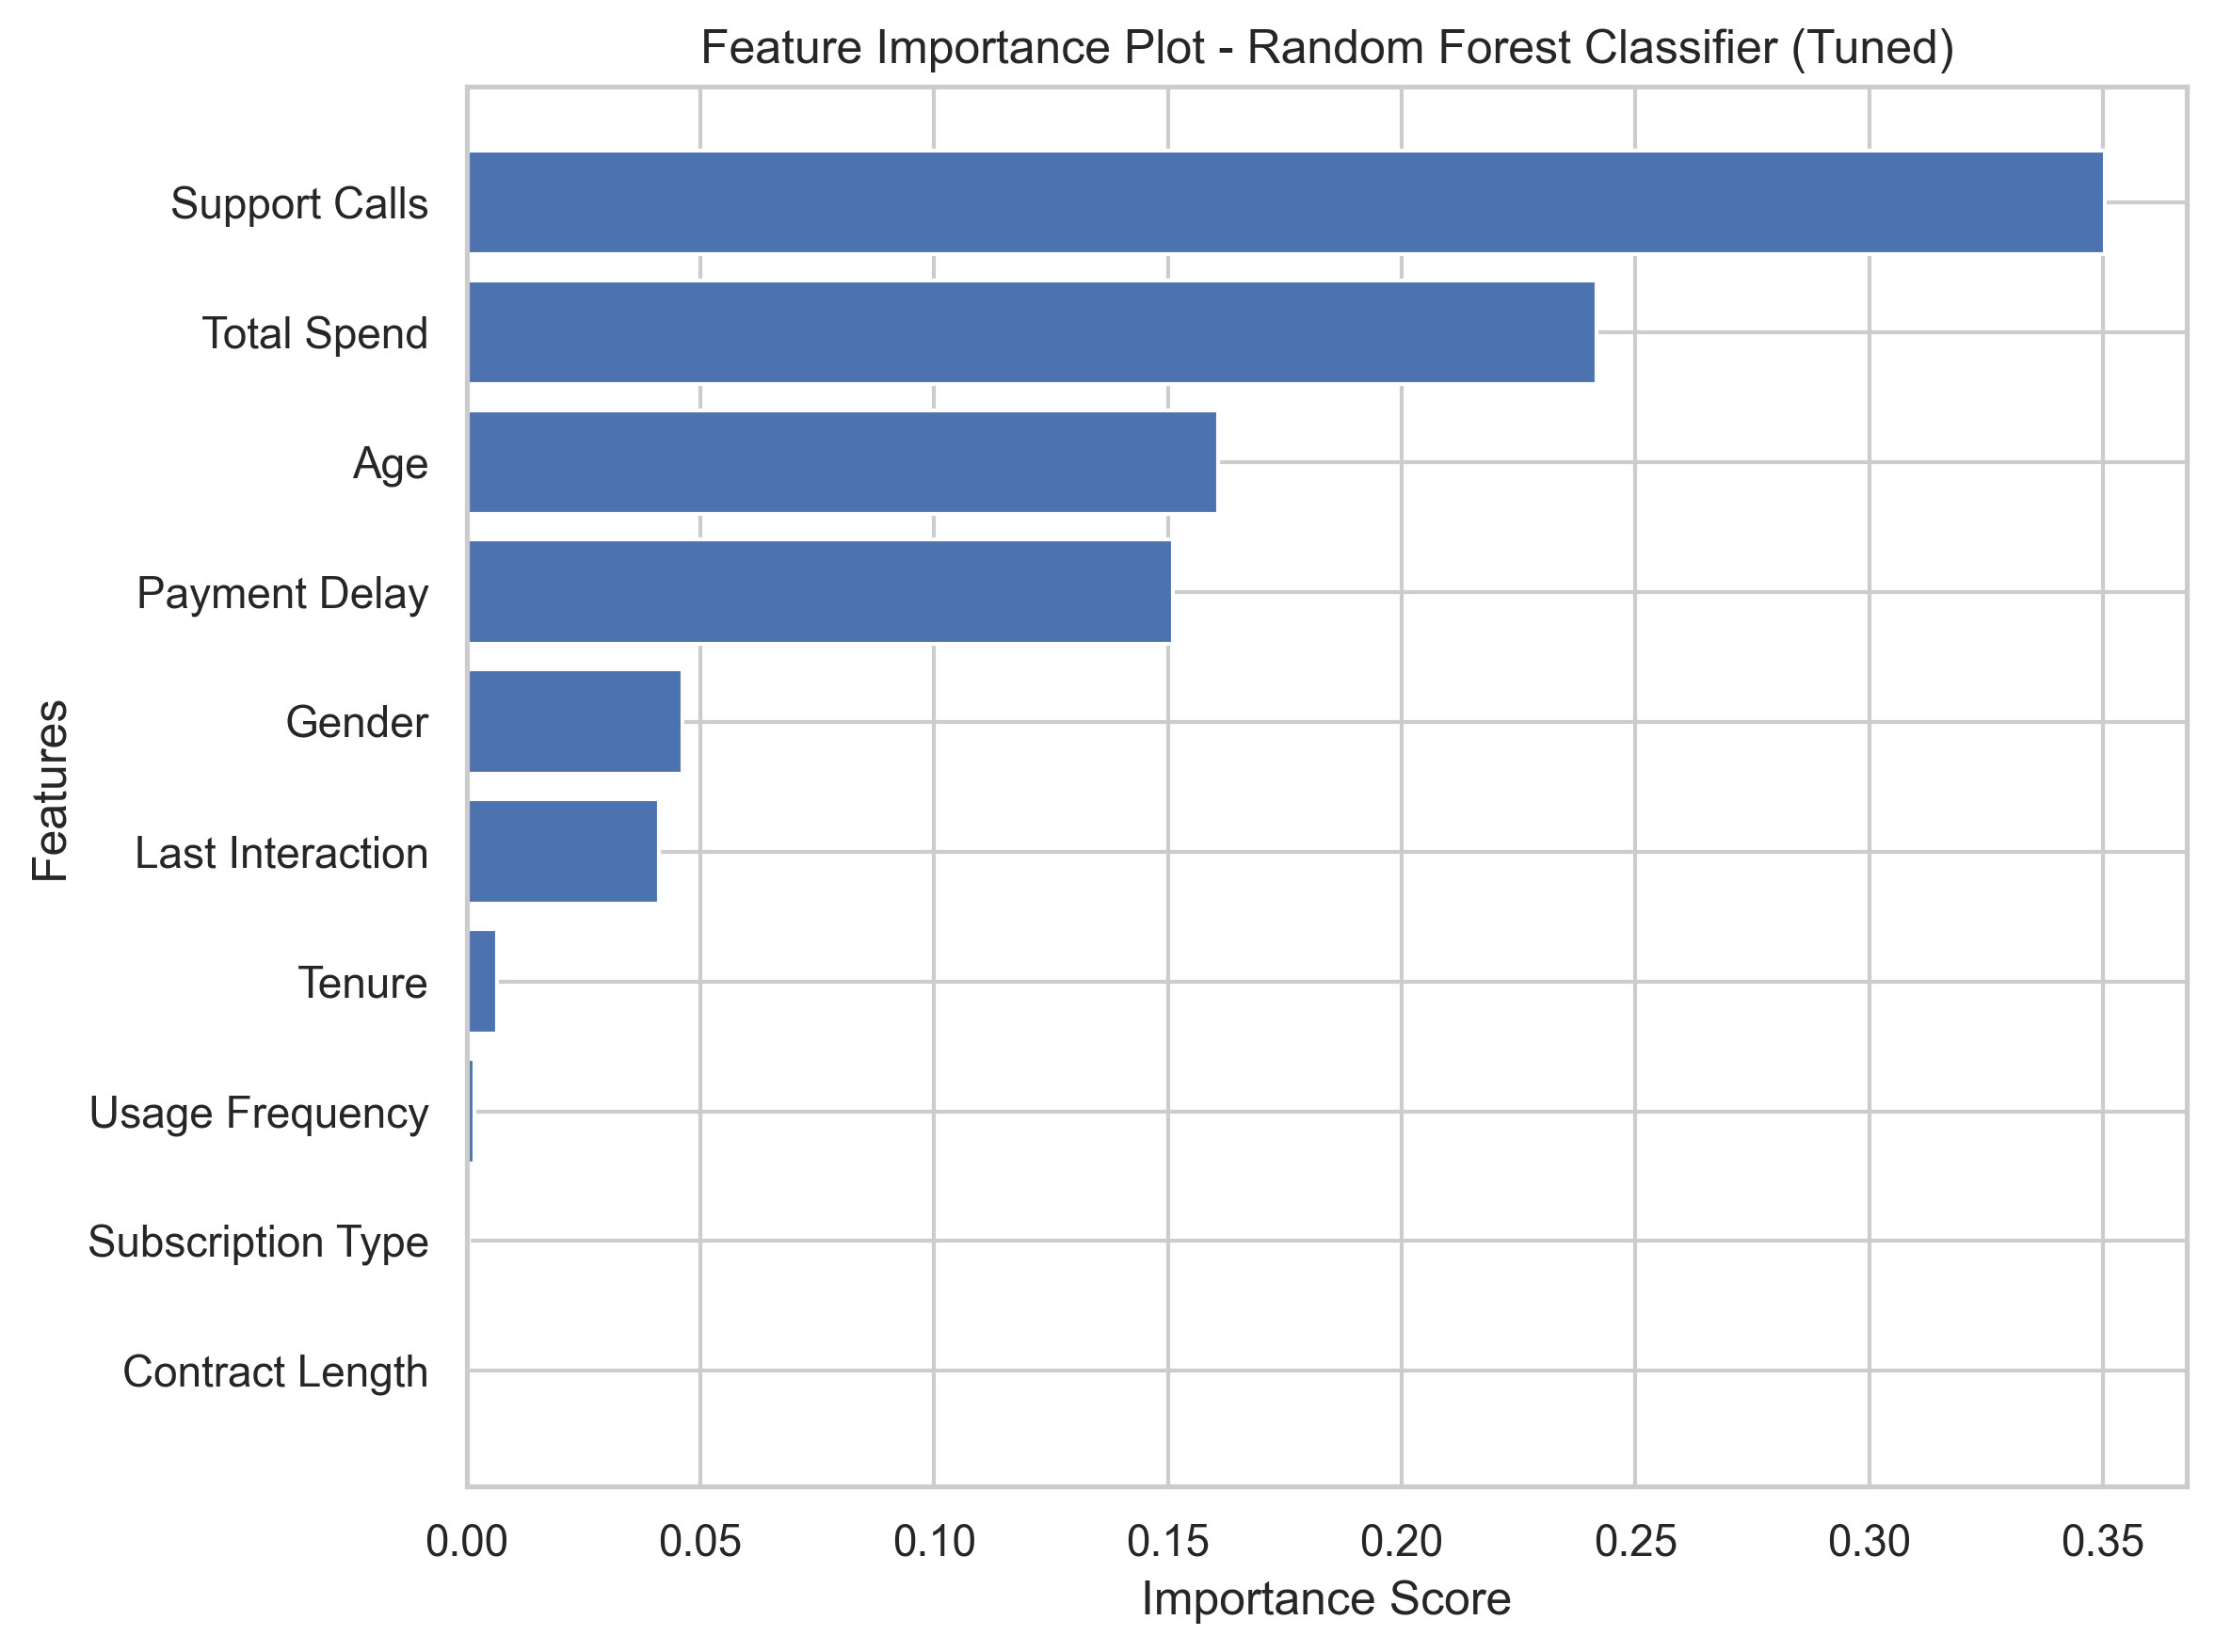
- Top drivers: Support Calls, Total Spend, Payment Delay.
- Tuned model emphasized different behavioral features (e.g., Age, Gender).
Logistic Regression Coefficients
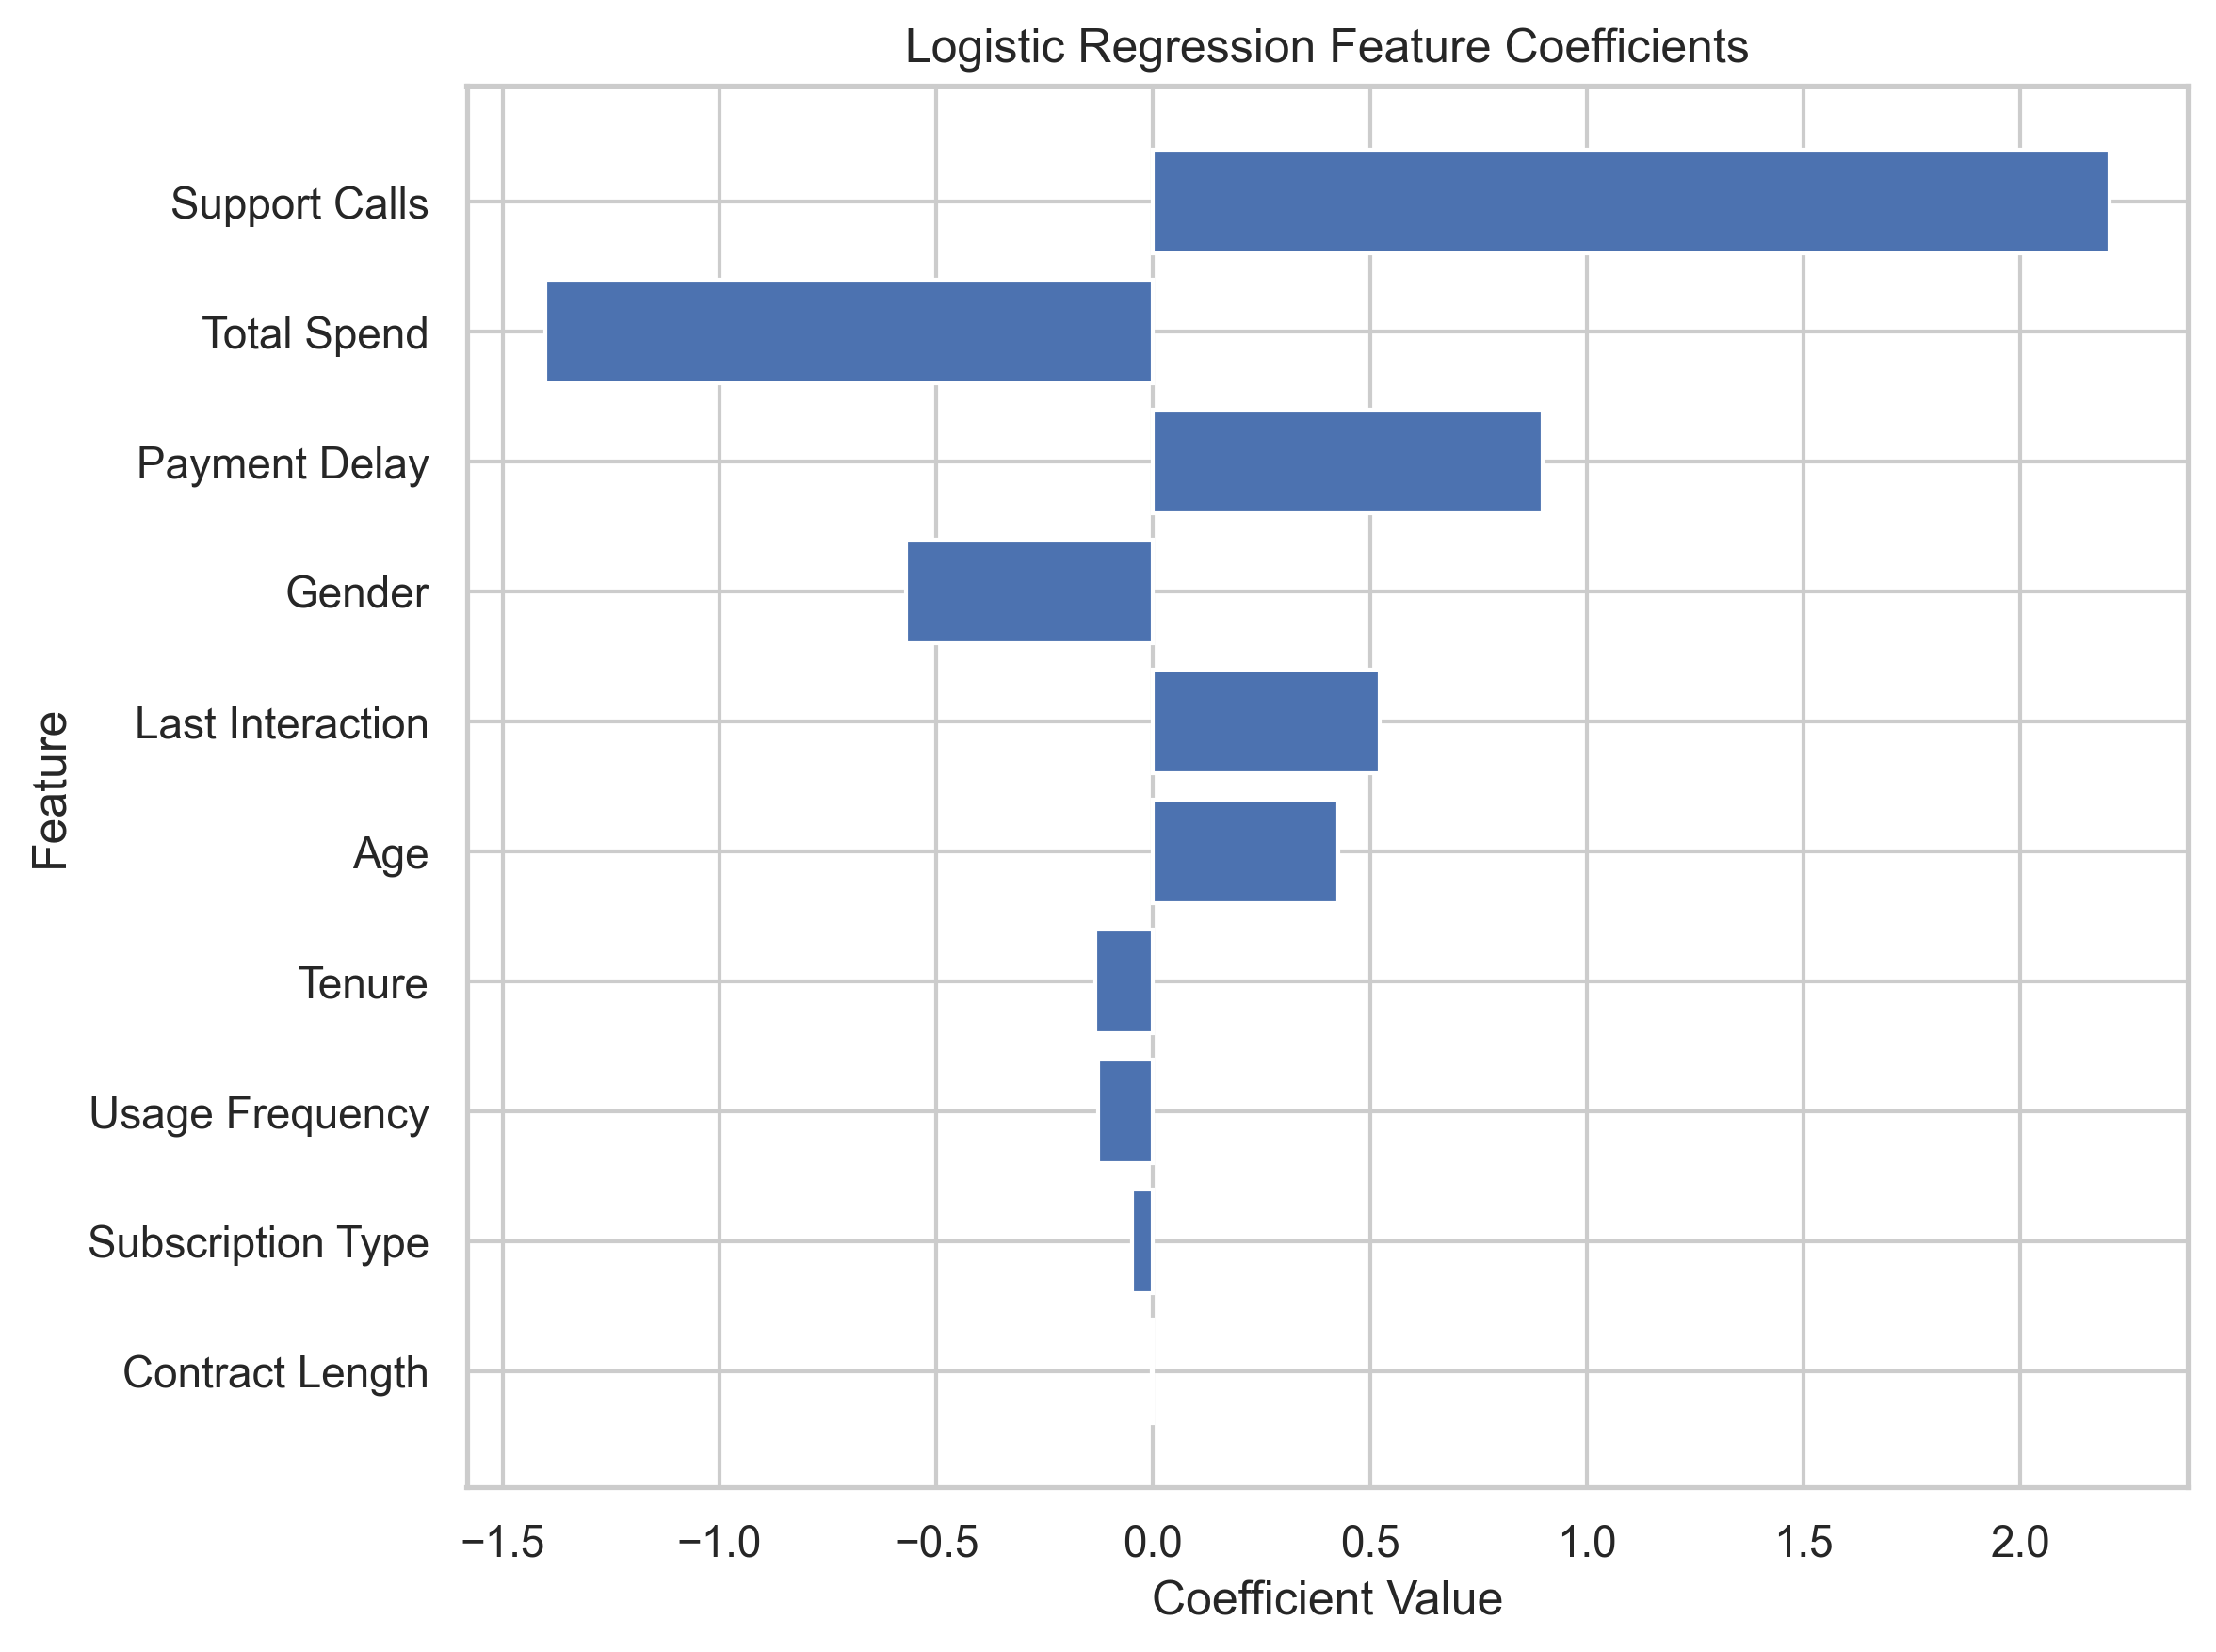
- Support Calls (+2.20), Payment Delay (+0.89), Inactivity (+0.52) increase churn risk.
- Tenure (–0.13), Total Spend (–1.40), Usage Frequency reduce churn risk.
Conclusion
- Logistic Regression provides strong AUC and interpretability, making it ideal for churn scoring.
- Behavioral features outperform demographics—support volume, payment issues, and inactivity are key churn flags.
- High-value users (long tenure, high spend) are more loyal—focus retention there.
Reproducibility
- Clone the repo:
git clone https://github.com/SebastianMarrero/SaaS_Churn_Analysis.git - Run
CustomerChurnEDA.ipynbin Jupyter Lab or VS Code - View outputs and visuals in
/assets/images
Created by Sebastian Marrero — sebastianmarrero64@gmail.com — LinkedIn